|
Download Data (XLS File) |
|
||||||||
|
||||||||
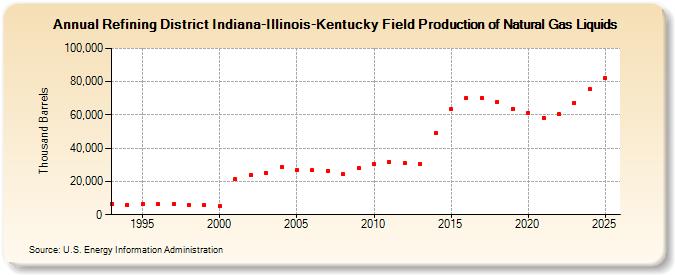
| Refining District Indiana-Illinois-Kentucky Field Production of Natural Gas Liquids (Thousand Barrels) | ||||||||
| Decade | Year-0 | Year-1 | Year-2 | Year-3 | Year-4 | Year-5 | Year-6 | Year-7 | Year-8 | Year-9 |
|---|---|---|---|---|---|---|---|---|---|---|
| 1990's | 6,580 | 5,961 | 6,409 | 6,363 | 6,686 | 5,903 | 5,710 | |||
| 2000's | 5,107 | 21,291 | 24,008 | 25,104 | 28,570 | 26,874 | 26,590 | 26,465 | 24,398 | 27,947 |
| 2010's | 30,542 | 31,816 | 31,186 | 30,599 | 49,017 | 63,496 | 70,254 | 70,438 | 67,825 | 63,807 |
| 2020's | 61,246 | 58,348 | 60,369 | 67,448 |
| - = No Data Reported; -- = Not Applicable; NA = Not Available; W = Withheld to avoid disclosure of individual company data. |
| Release Date: 8/30/2024 |
| Next Release Date: 8/29/2025 |