|
Download Data (XLS File) |
|
||||||||
|
||||||||
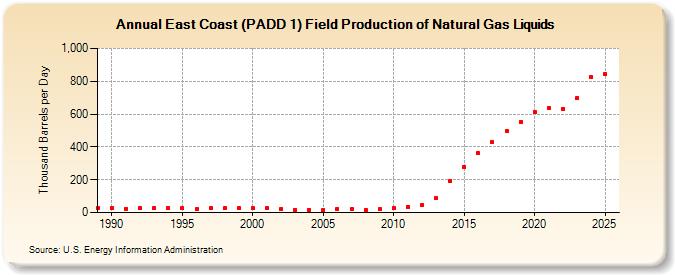
| East Coast (PADD 1) Field Production of Natural Gas Liquids (Thousand Barrels per Day) | ||||||||
| Decade | Year-0 | Year-1 | Year-2 | Year-3 | Year-4 | Year-5 | Year-6 | Year-7 | Year-8 | Year-9 |
|---|---|---|---|---|---|---|---|---|---|---|
| 1980's | 28 | |||||||||
| 1990's | 25 | 24 | 26 | 28 | 26 | 26 | 21 | 26 | 26 | 26 |
| 2000's | 26 | 26 | 23 | 18 | 18 | 17 | 22 | 20 | 18 | 20 |
| 2010's | 27 | 36 | 45 | 87 | 194 | 278 | 361 | 427 | 497 | 552 |
| 2020's | 613 | 635 | 633 | 696 |
| - = No Data Reported; -- = Not Applicable; NA = Not Available; W = Withheld to avoid disclosure of individual company data. |
| Release Date: 4/30/2024 |
| Next Release Date: 8/30/2024 |