|
Download Data (XLS File) |
|
||||||||
|
||||||||
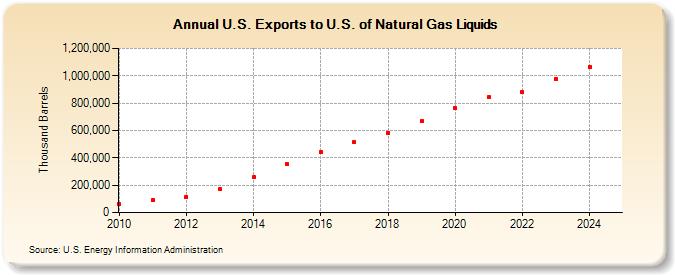
| U.S. Exports to U.S. of Natural Gas Liquids (Thousand Barrels) | ||||||||
| Decade | Year-0 | Year-1 | Year-2 | Year-3 | Year-4 | Year-5 | Year-6 | Year-7 | Year-8 | Year-9 |
|---|---|---|---|---|---|---|---|---|---|---|
| 2010's | 59,842 | 90,968 | 115,054 | 170,941 | 256,587 | 352,618 | 443,388 | 512,495 | 584,596 | 667,957 |
| 2020's | 761,581 | 842,796 | 879,446 | 978,453 | 1,066,237 |
| - = No Data Reported; -- = Not Applicable; NA = Not Available; W = Withheld to avoid disclosure of individual company data. |
| Release Date: 6/30/2025 |
| Next Release Date: 8/29/2025 |