|
Download Data (XLS File) |
|
||||||||
|
||||||||
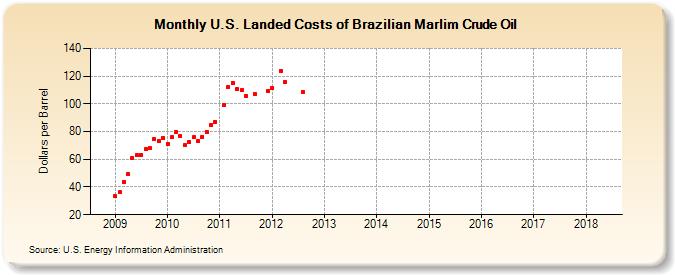
| U.S. Landed Costs of Brazilian Marlim Crude Oil (Dollars per Barrel) | ||||||||
| Year | Jan | Feb | Mar | Apr | May | Jun | Jul | Aug | Sep | Oct | Nov | Dec |
|---|---|---|---|---|---|---|---|---|---|---|---|---|
| 2009 | 33.22 | 36.04 | 43.91 | 49.09 | 60.75 | 62.88 | 63.14 | 67.07 | 67.97 | 74.40 | 73.06 | 75.50 |
| 2010 | 71.02 | 76.04 | 79.72 | 76.78 | 70.25 | 72.37 | 75.88 | 73.17 | 76.18 | 79.68 | 84.62 | 87.11 |
| 2011 | W | 98.80 | 112.23 | 115.04 | 110.84 | 109.82 | 105.86 | W | 107.24 | W | W | 109.22 |
| 2012 | 111.09 | W | 123.90 | 115.91 | W | W | 108.42 | |||||
| 2013 | W | W | W | W | W | W | ||||||
| 2014 | W | W | W | W | W | W | ||||||
| 2015 | W | W | W | W | W | W | ||||||
| 2016 | W | W | W | |||||||||
| 2017 | W | W | W | W | ||||||||
| 2018 | W | W | ||||||||||
| - = No Data Reported; -- = Not Applicable; NA = Not Available; W = Withheld to avoid disclosure of individual company data. |
| Release Date: 8/1/2024 |
| Next Release Date: 9/3/2024 |