|
Download Data (XLS File) |
|
||||||||
|
||||||||
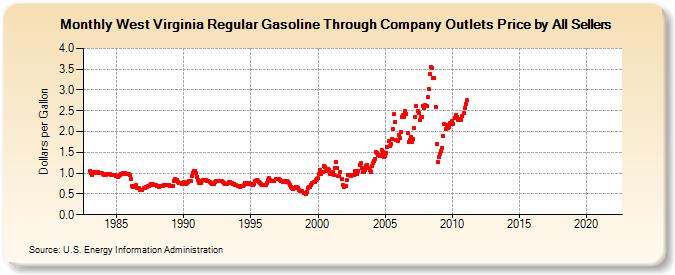
| West Virginia Regular Gasoline Through Company Outlets Price by All Sellers (Dollars per Gallon) | ||||||||
| Year | Jan | Feb | Mar | Apr | May | Jun | Jul | Aug | Sep | Oct | Nov | Dec |
|---|---|---|---|---|---|---|---|---|---|---|---|---|
| 1983 | 1.047 | 1.005 | 0.960 | 1.003 | 1.018 | 1.024 | 1.012 | 1.016 | 1.012 | 1.010 | 1.001 | 0.993 |
| 1984 | 0.975 | 0.967 | 0.967 | 0.977 | 0.978 | 0.978 | 0.972 | 0.965 | 0.957 | 0.956 | 0.950 | 0.943 |
| 1985 | 0.924 | 0.915 | 0.935 | 0.956 | 0.984 | 0.991 | 0.995 | 0.992 | 0.978 | 0.973 | 0.976 | 0.974 |
| 1986 | 0.951 | 0.868 | 0.699 | 0.672 | 0.695 | 0.708 | 0.652 | 0.641 | 0.636 | 0.605 | 0.594 | 0.605 |
| 1987 | 0.648 | 0.649 | 0.673 | 0.674 | 0.688 | 0.690 | 0.716 | 0.738 | 0.733 | 0.724 | 0.715 | 0.709 |
| 1988 | 0.696 | 0.681 | 0.673 | 0.682 | 0.699 | 0.699 | 0.715 | 0.724 | 0.714 | 0.709 | 0.707 | 0.703 |
| 1989 | 0.696 | 0.692 | 0.699 | 0.821 | 0.855 | 0.844 | 0.831 | 0.789 | 0.772 | 0.764 | 0.738 | 0.757 |
| 1990 | 0.776 | 0.764 | 0.746 | 0.760 | 0.792 | 0.806 | 0.806 | 0.940 | 1.014 | 1.054 | 1.055 | 0.994 |
| 1991 | 0.916 | 0.823 | 0.768 | 0.772 | 0.812 | 0.830 | 0.831 | 0.834 | 0.835 | 0.819 | 0.821 | 0.796 |
| 1992 | 0.762 | 0.732 | 0.731 | 0.747 | 0.783 | 0.819 | 0.818 | 0.806 | 0.806 | 0.802 | 0.799 | 0.794 |
| 1993 | 0.762 | 0.744 | 0.736 | 0.747 | 0.781 | 0.776 | 0.770 | 0.751 | 0.737 | 0.734 | 0.716 | 0.703 |
| 1994 | 0.690 | 0.686 | 0.675 | 0.680 | 0.691 | 0.697 | 0.721 | 0.766 | 0.764 | 0.746 | 0.762 | 0.744 |
| 1995 | 0.736 | 0.724 | 0.717 | 0.746 | 0.817 | 0.831 | 0.815 | 0.782 | 0.754 | 0.734 | 0.708 | 0.709 |
| 1996 | 0.710 | 0.716 | 0.751 | 0.830 | 0.871 | 0.842 | 0.816 | 0.808 | 0.804 | 0.811 | 0.857 | 0.865 |
| 1997 | 0.866 | 0.862 | 0.835 | 0.822 | 0.808 | 0.798 | 0.785 | 0.808 | 0.808 | 0.781 | 0.751 | 0.712 |
| 1998 | 0.674 | 0.648 | 0.628 | 0.642 | 0.673 | 0.669 | 0.643 | 0.592 | 0.570 | 0.578 | 0.569 | 0.522 |
| 1999 | 0.514 | 0.487 | 0.558 | 0.648 | 0.673 | 0.665 | 0.708 | 0.751 | 0.777 | 0.782 | 0.831 | 0.860 |
| 2000 | 0.872 | 0.982 | 1.083 | 0.987 | 1.029 | 1.174 | 1.158 | 1.045 | 1.106 | 1.094 | 1.086 | 0.977 |
| 2001 | 1.009 | 1.025 | 0.964 | 1.128 | 1.262 | 1.125 | 0.924 | 0.936 | 1.024 | 0.857 | 0.722 | 0.664 |
| 2002 | 0.699 | 0.685 | 0.827 | 0.963 | 0.956 | 0.936 | 0.946 | 0.945 | 0.960 | 1.040 | 1.001 | 0.977 |
| 2003 | 1.056 | 1.203 | 1.236 | 1.124 | 1.039 | 1.035 | 1.067 | 1.175 | 1.205 | 1.120 | 1.065 | 1.036 |
| 2004 | 1.175 | 1.234 | 1.280 | 1.350 | 1.516 | 1.481 | 1.432 | 1.423 | 1.434 | 1.564 | 1.510 | 1.380 |
| 2005 | 1.401 | 1.479 | 1.630 | 1.766 | 1.641 | 1.693 | 1.823 | 2.056 | 2.412 | 2.240 | 1.792 | 1.778 |
| 2006 | 1.923 | 1.837 | 1.994 | 2.360 | 2.390 | 2.356 | 2.488 | 2.432 | 1.961 | 1.746 | 1.797 | 1.862 |
| 2007 | 1.749 | 1.811 | 2.094 | 2.360 | 2.622 | 2.492 | 2.450 | 2.283 | 2.348 | 2.353 | 2.618 | 2.575 |
| 2008 | 2.629 | 2.624 | 2.821 | 3.013 | 3.394 | 3.550 | 3.526 | 3.289 | 3.296 | 2.602 | 1.690 | 1.265 |
| 2009 | 1.385 | 1.468 | 1.521 | 1.601 | 1.891 | 2.193 | 2.071 | 2.157 | 2.076 | 2.114 | 2.203 | 2.170 |
| 2010 | 2.265 | 2.192 | 2.332 | 2.404 | 2.353 | 2.272 | 2.297 | 2.266 | 2.286 | 2.367 | 2.448 | 2.567 |
| 2011 | 2.671 | 2.751 | - | - | - | - | - | - | - | - | - | - |
| 2012 | - | - | - | - | - | - | - | - | - | - | - | - |
| 2013 | - | - | - | - | - | - | - | - | - | - | - | - |
| 2014 | - | - | - | - | - | - | - | - | - | - | - | - |
| 2015 | - | - | - | - | - | - | - | - | - | - | - | - |
| 2016 | - | - | - | - | - | - | - | - | - | - | - | - |
| 2017 | - | - | - | - | - | - | - | - | - | - | - | - |
| 2018 | - | - | - | - | - | - | - | - | - | - | - | - |
| 2019 | - | - | - | - | - | - | - | - | - | - | - | - |
| 2020 | - | - | - | - | - | - | - | - | - | - | - | - |
| 2021 | - | - | - | - | - | - | - | - | - | - | - | - |
| 2022 | - | - | - | |||||||||
| - = No Data Reported; -- = Not Applicable; NA = Not Available; W = Withheld to avoid disclosure of individual company data. |
| Release Date: 6/1/2022 |
| Next Release Date: TBD |