|
Download Data (XLS File) |
|
||||||||||||
|
||||||||||||
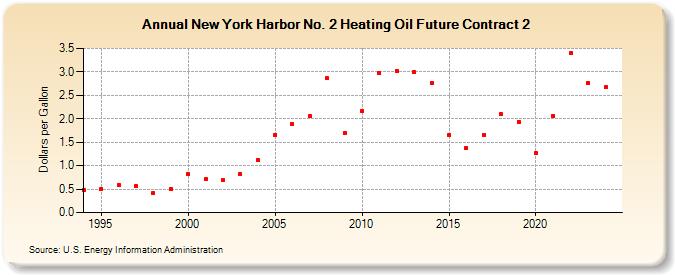
| New York Harbor No. 2 Heating Oil Future Contract 2 (Dollars per Gallon) | ||||||||||||
| Decade | Year-0 | Year-1 | Year-2 | Year-3 | Year-4 | Year-5 | Year-6 | Year-7 | Year-8 | Year-9 |
|---|---|---|---|---|---|---|---|---|---|---|
| 1990's | 0.484 | 0.498 | 0.596 | 0.565 | 0.408 | 0.498 | ||||
| 2000's | 0.818 | 0.709 | 0.691 | 0.822 | 1.124 | 1.659 | 1.881 | 2.051 | 2.862 | 1.693 |
| 2010's | 2.164 | 2.966 | 3.026 | 2.996 | 2.759 | 1.661 | 1.378 | 1.661 | 2.095 | 1.940 |
| 2020's | 1.264 | 2.066 | 3.409 | 2.767 |
| - = No Data Reported; -- = Not Applicable; NA = Not Available; W = Withheld to avoid disclosure of individual company data. |
| Release Date: 9/18/2024 |
| Next Release Date: 9/25/2024 |