|
Download Data (XLS File) |
|
||||||||
|
||||||||
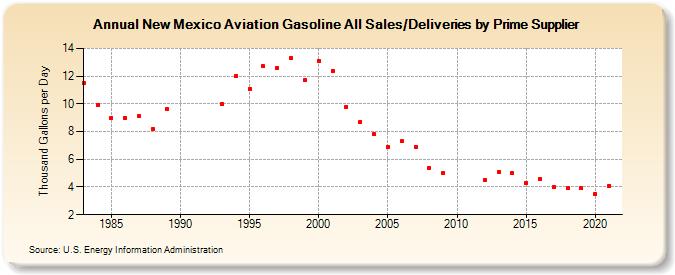
| New Mexico Aviation Gasoline All Sales/Deliveries by Prime Supplier (Thousand Gallons per Day) | ||||||||
| Decade | Year-0 | Year-1 | Year-2 | Year-3 | Year-4 | Year-5 | Year-6 | Year-7 | Year-8 | Year-9 |
|---|---|---|---|---|---|---|---|---|---|---|
| 1980's | 11.5 | 9.9 | 9.0 | 9.0 | 9.1 | 8.2 | 9.6 | |||
| 1990's | W | W | W | 10.0 | 12.0 | 11.1 | 12.7 | 12.6 | 13.3 | 11.7 |
| 2000's | 13.1 | 12.4 | 9.8 | 8.7 | 7.8 | 6.9 | 7.3 | 6.9 | 5.4 | 5.0 |
| 2010's | W | W | 4.5 | 5.1 | 5.0 | 4.3 | 4.6 | 4.0 | 3.9 | 3.9 |
| 2020's | 3.5 |
| - = No Data Reported; -- = Not Applicable; NA = Not Available; W = Withheld to avoid disclosure of individual company data. |
| Release Date: 6/1/2022 |
| Next Release Date: TBD |