|
Download Data (XLS File) |
|
||||||||
|
||||||||
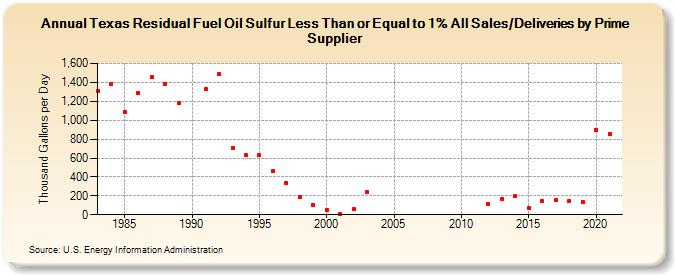
| Texas Residual Fuel Oil Sulfur Less Than or Equal to 1% All Sales/Deliveries by Prime Supplier (Thousand Gallons per Day) | ||||||||
| Decade | Year-0 | Year-1 | Year-2 | Year-3 | Year-4 | Year-5 | Year-6 | Year-7 | Year-8 | Year-9 |
|---|---|---|---|---|---|---|---|---|---|---|
| 1980's | 1,308.9 | 1,386.9 | 1,086.7 | 1,287.7 | 1,459.7 | 1,382.1 | 1,185.4 | |||
| 1990's | W | 1,329.9 | 1,485.7 | 705.2 | 627.8 | 628.4 | 457.8 | 335.9 | 184.0 | 99.2 |
| 2000's | 52.7 | 10.7 | 59.3 | 236.0 | W | W | W | W | W | W |
| 2010's | W | W | 115.3 | 168.4 | 197.8 | 70.1 | 140.9 | 151.2 | 146.4 | 132.6 |
| 2020's | 899.5 |
| - = No Data Reported; -- = Not Applicable; NA = Not Available; W = Withheld to avoid disclosure of individual company data. |
| Release Date: 6/1/2022 |
| Next Release Date: TBD |