|
Download Data (XLS File) |
|
||||||||
|
||||||||
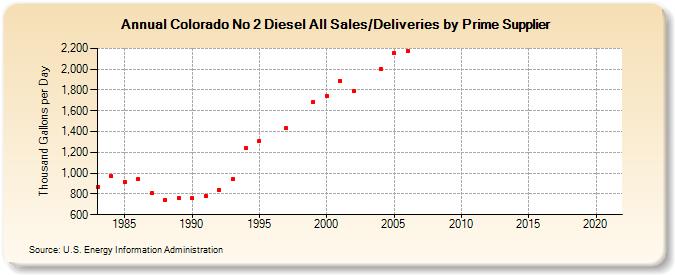
| Colorado No 2 Diesel All Sales/Deliveries by Prime Supplier (Thousand Gallons per Day) | ||||||||
| Decade | Year-0 | Year-1 | Year-2 | Year-3 | Year-4 | Year-5 | Year-6 | Year-7 | Year-8 | Year-9 |
|---|---|---|---|---|---|---|---|---|---|---|
| 1980's | 867.1 | 969.7 | 918.5 | 943.6 | 808.8 | 746.2 | 760.8 | |||
| 1990's | 758.2 | 779.1 | 840.9 | 939.8 | 1,239.1 | 1,309.9 | W | 1,431.9 | W | 1,684.0 |
| 2000's | 1,746.0 | 1,890.5 | 1,792.2 | W | 1,999.4 | 2,154.4 | 2,179.6 | NA | NA | NA |
| 2010's | NA | NA | NA | NA | NA | NA | NA | NA | NA | NA |
| 2020's | NA |
| - = No Data Reported; -- = Not Applicable; NA = Not Available; W = Withheld to avoid disclosure of individual company data. |
| Release Date: 6/1/2022 |
| Next Release Date: TBD |