|
Download Data (XLS File) |
|
||||||||
|
||||||||
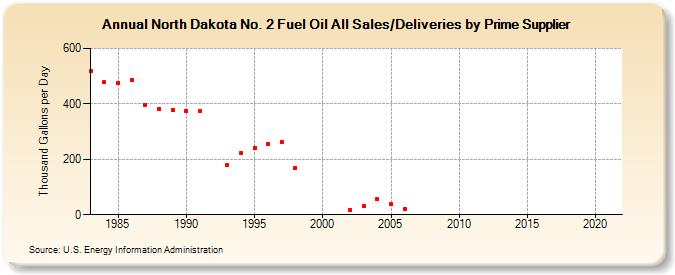
| North Dakota No. 2 Fuel Oil All Sales/Deliveries by Prime Supplier (Thousand Gallons per Day) | ||||||||
| Decade | Year-0 | Year-1 | Year-2 | Year-3 | Year-4 | Year-5 | Year-6 | Year-7 | Year-8 | Year-9 |
|---|---|---|---|---|---|---|---|---|---|---|
| 1980's | 518.6 | 477.8 | 476.6 | 485.9 | 396.7 | 382.3 | 377.1 | |||
| 1990's | 375.1 | 372.9 | W | 179.6 | 223.0 | 239.0 | 254.4 | 261.8 | 169.7 | W |
| 2000's | W | W | 18.4 | 31.3 | 56.4 | 37.0 | 21.7 | W | W | W |
| 2010's | W | W | W | W | W | W | W | W | W | W |
| 2020's | W |
| - = No Data Reported; -- = Not Applicable; NA = Not Available; W = Withheld to avoid disclosure of individual company data. |
| Release Date: 6/1/2022 |
| Next Release Date: TBD |