|
Download Data (XLS File) |
|
||||||||
|
||||||||
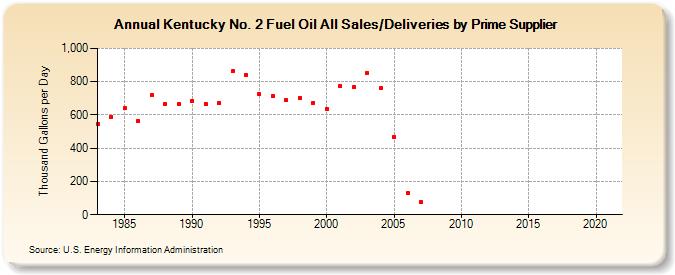
| Kentucky No. 2 Fuel Oil All Sales/Deliveries by Prime Supplier (Thousand Gallons per Day) | ||||||||
| Decade | Year-0 | Year-1 | Year-2 | Year-3 | Year-4 | Year-5 | Year-6 | Year-7 | Year-8 | Year-9 |
|---|---|---|---|---|---|---|---|---|---|---|
| 1980's | 546.2 | 589.4 | 639.5 | 564.0 | 718.1 | 667.2 | 663.0 | |||
| 1990's | 685.6 | 667.6 | 674.0 | 862.5 | 840.8 | 723.7 | 713.8 | 688.2 | 704.6 | 673.3 |
| 2000's | 637.0 | 772.9 | 765.8 | 852.7 | 759.9 | 468.5 | 130.5 | 74.7 | W | W |
| 2010's | W | W | W | W | W | W | W | W | W | - |
| 2020's | - |
| - = No Data Reported; -- = Not Applicable; NA = Not Available; W = Withheld to avoid disclosure of individual company data. |
| Release Date: 6/1/2022 |
| Next Release Date: TBD |