|
Download Data (XLS File) |
|
||||||||
|
||||||||
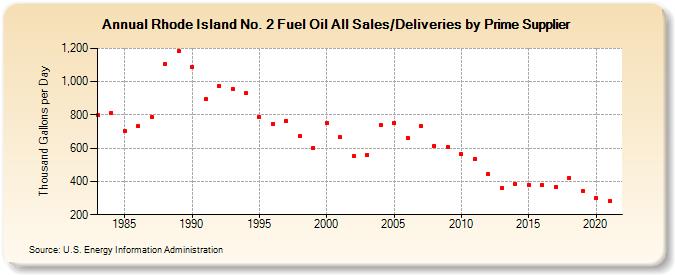
| Rhode Island No. 2 Fuel Oil All Sales/Deliveries by Prime Supplier (Thousand Gallons per Day) | ||||||||
| Decade | Year-0 | Year-1 | Year-2 | Year-3 | Year-4 | Year-5 | Year-6 | Year-7 | Year-8 | Year-9 |
|---|---|---|---|---|---|---|---|---|---|---|
| 1980's | 798.2 | 813.5 | 702.5 | 731.6 | 789.1 | 1,108.6 | 1,185.2 | |||
| 1990's | 1,086.6 | 895.2 | 975.6 | 957.2 | 928.9 | 786.2 | 745.6 | 764.3 | 673.2 | 601.5 |
| 2000's | 750.6 | 665.6 | 551.0 | 560.4 | 739.2 | 750.8 | 663.7 | 731.6 | 613.4 | 605.0 |
| 2010's | 564.4 | 533.7 | 442.8 | 362.6 | 384.9 | 380.8 | 380.9 | 367.5 | 422.9 | 342.8 |
| 2020's | 303.2 |
| - = No Data Reported; -- = Not Applicable; NA = Not Available; W = Withheld to avoid disclosure of individual company data. |
| Release Date: 6/1/2022 |
| Next Release Date: TBD |