|
Download Data (XLS File) |
|
||||||||
|
||||||||
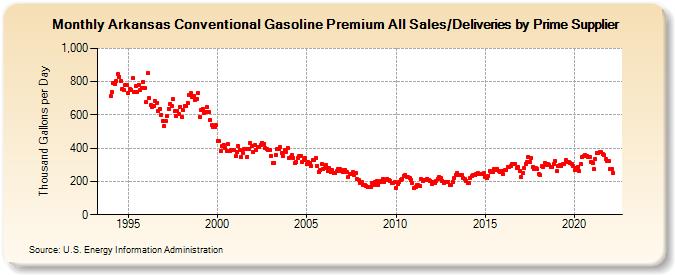
| Arkansas Conventional Gasoline Premium All Sales/Deliveries by Prime Supplier (Thousand Gallons per Day) | ||||||||
| Year | Jan | Feb | Mar | Apr | May | Jun | Jul | Aug | Sep | Oct | Nov | Dec |
|---|---|---|---|---|---|---|---|---|---|---|---|---|
| 1993 | NA | NA | NA | |||||||||
| 1994 | 712.2 | 736.9 | 793.9 | 787.3 | 804.6 | 843.3 | 828.0 | 803.7 | 757.7 | 750.9 | 782.7 | 780.1 |
| 1995 | 729.3 | 757.2 | 749.9 | 819.1 | 734.8 | 774.0 | 739.8 | 780.3 | 750.6 | 759.1 | 797.7 | 763.8 |
| 1996 | 676.4 | 851.0 | 700.8 | 658.8 | 647.0 | 653.6 | 681.2 | 669.9 | 626.3 | 637.4 | 601.5 | 565.1 |
| 1997 | 530.8 | 565.3 | 595.9 | 638.4 | 665.5 | 654.9 | 693.1 | 620.6 | 594.5 | 623.2 | 603.8 | 648.7 |
| 1998 | 585.1 | 627.1 | 654.3 | 655.3 | 674.5 | 717.2 | 729.1 | 709.0 | 711.2 | 687.0 | 694.4 | 730.8 |
| 1999 | 588.5 | 630.4 | 637.7 | 613.0 | 618.7 | 646.6 | 616.8 | 572.3 | 537.7 | 525.9 | 530.2 | 537.5 |
| 2000 | 443.2 | 441.4 | 380.7 | 410.2 | 421.4 | 399.7 | 384.3 | 422.2 | 384.2 | 386.6 | 387.5 | 391.8 |
| 2001 | 351.4 | 374.8 | 410.5 | 390.3 | 345.9 | 370.0 | 393.0 | 397.8 | 349.9 | 396.3 | 429.9 | 415.8 |
| 2002 | 376.6 | 421.1 | 389.9 | 408.4 | 406.4 | 419.6 | 433.6 | 428.0 | 398.5 | 396.2 | 391.4 | 389.7 |
| 2003 | 353.7 | 308.1 | 313.1 | 361.5 | 393.2 | 393.1 | 404.4 | 372.4 | 354.4 | 387.2 | 378.6 | 399.9 |
| 2004 | 341.3 | 345.3 | 356.8 | 339.5 | 308.7 | 318.1 | 339.1 | 355.3 | 353.5 | 317.5 | 327.2 | 338.6 |
| 2005 | 302.5 | 315.6 | 309.9 | 290.7 | 327.6 | 331.0 | 340.1 | 295.2 | 258.9 | 270.1 | 306.2 | 274.9 |
| 2006 | 278.0 | 295.9 | 265.8 | 280.1 | 254.8 | 266.3 | 249.5 | 253.8 | 261.7 | 277.5 | 275.2 | 262.3 |
| 2007 | 255.1 | 268.9 | 270.2 | 256.7 | 229.0 | 245.0 | 244.0 | 257.8 | 239.9 | 249.6 | 212.1 | 206.0 |
| 2008 | 190.7 | 196.5 | 179.7 | 177.6 | 172.9 | 163.9 | 165.0 | 169.3 | 193.4 | 180.7 | 194.1 | 201.5 |
| 2009 | 178.5 | 197.1 | 200.6 | 216.2 | 199.5 | 208.6 | 216.5 | 210.5 | 203.3 | 191.7 | 190.3 | 197.5 |
| 2010 | 163.3 | 184.0 | 199.3 | 211.3 | 215.6 | 231.4 | 239.0 | 228.1 | 227.5 | 220.1 | 210.1 | 187.8 |
| 2011 | 162.3 | 166.2 | 177.2 | 178.5 | 173.4 | 213.2 | 200.2 | 210.1 | 207.7 | 217.5 | 211.7 | 205.6 |
| 2012 | 184.4 | 193.9 | 192.0 | 204.0 | 217.4 | 227.9 | 221.4 | 204.9 | 190.8 | 198.9 | 197.2 | 197.3 |
| 2013 | 179.4 | 181.2 | 196.9 | 218.0 | 238.5 | 247.8 | 237.1 | 236.5 | 238.3 | 220.0 | 217.4 | 203.4 |
| 2014 | 193.3 | 190.1 | 222.9 | 231.7 | 239.2 | 240.8 | 243.5 | 251.7 | 242.8 | 242.2 | 243.5 | 248.1 |
| 2015 | 229.7 | 219.8 | 234.1 | 260.4 | 256.1 | 255.5 | 272.5 | 267.4 | 275.0 | 263.5 | 254.2 | 264.7 |
| 2016 | 243.0 | 267.4 | 271.5 | 286.0 | 285.9 | 293.0 | 306.3 | 305.6 | 306.0 | 280.2 | 288.7 | 260.4 |
| 2017 | 226.0 | 249.3 | 278.7 | 306.7 | 315.4 | 349.2 | 317.3 | 339.9 | 289.6 | 276.7 | 278.4 | 275.6 |
| 2018 | 245.1 | 237.1 | 291.2 | 288.7 | 313.4 | 300.8 | 302.2 | 300.3 | 285.3 | 287.3 | 305.0 | 323.7 |
| 2019 | 261.0 | 292.9 | 296.2 | 293.6 | 304.4 | 306.7 | 327.4 | 317.3 | 318.5 | 312.2 | 303.0 | 293.2 |
| 2020 | 268.6 | 278.4 | 286.8 | 265.2 | 302.8 | 344.2 | 354.5 | 358.1 | 355.8 | 344.2 | 345.8 | 319.5 |
| 2021 | 312.1 | 275.0 | 334.5 | 373.2 | 372.6 | 374.1 | 374.3 | 362.7 | 356.8 | 335.1 | 321.7 | 322.5 |
| 2022 | 274.9 | 276.1 | 252.4 | |||||||||
| - = No Data Reported; -- = Not Applicable; NA = Not Available; W = Withheld to avoid disclosure of individual company data. |
| Release Date: 5/19/2022 |
| Next Release Date: TBD |