|
Download Data (XLS File) |
|
||||||||
|
||||||||
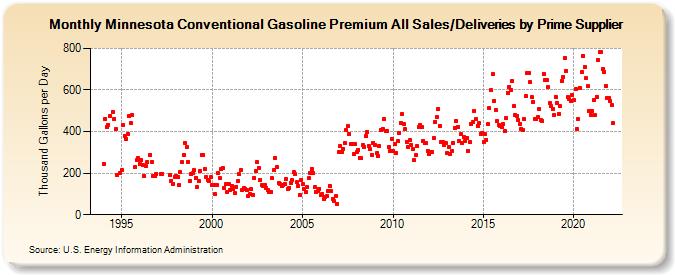
| Minnesota Conventional Gasoline Premium All Sales/Deliveries by Prime Supplier (Thousand Gallons per Day) | ||||||||
| Year | Jan | Feb | Mar | Apr | May | Jun | Jul | Aug | Sep | Oct | Nov | Dec |
|---|---|---|---|---|---|---|---|---|---|---|---|---|
| 1993 | NA | NA | NA | |||||||||
| 1994 | 245.4 | 462.3 | 421.1 | 433.5 | 473.6 | W | 496.0 | 461.8 | 411.0 | 189.0 | W | 200.8 |
| 1995 | 216.5 | 431.8 | 380.1 | 364.5 | 387.4 | 473.9 | 441.9 | 481.7 | W | 228.8 | 261.4 | 272.3 |
| 1996 | 245.1 | 262.9 | 237.3 | 187.6 | 234.1 | 254.7 | W | 288.8 | 254.5 | 184.6 | 185.4 | 197.1 |
| 1997 | W | W | 198.2 | 198.2 | W | W | W | W | 189.6 | 163.8 | 148.0 | 182.3 |
| 1998 | 187.0 | 182.3 | 141.5 | 204.8 | 251.9 | 287.0 | 346.8 | 326.5 | 253.1 | 161.3 | 196.5 | 199.2 |
| 1999 | 213.6 | 177.8 | 134.7 | 161.6 | 210.5 | 288.0 | 287.3 | 221.0 | 181.3 | 166.1 | 160.1 | 181.6 |
| 2000 | 140.6 | 145.2 | 97.4 | 142.4 | 200.5 | 177.0 | 220.8 | 224.4 | 129.2 | 146.4 | 110.8 | 146.1 |
| 2001 | 120.5 | 139.5 | 122.8 | 102.6 | 134.9 | 161.3 | 194.5 | 215.7 | 119.9 | 130.6 | 124.4 | 117.5 |
| 2002 | 89.6 | 99.3 | 121.9 | 95.7 | 177.5 | 210.3 | 252.1 | 226.1 | 167.7 | 143.0 | 137.2 | 144.1 |
| 2003 | 129.6 | 119.6 | 110.5 | 110.4 | 175.1 | 213.1 | 272.2 | 228.0 | 153.2 | 147.4 | 135.8 | 141.6 |
| 2004 | 148.4 | 170.3 | 122.3 | 129.7 | 154.4 | 165.1 | 203.4 | 194.4 | 155.0 | 140.1 | 97.0 | 168.9 |
| 2005 | 145.4 | 124.8 | 110.4 | 131.9 | 174.2 | 201.6 | 221.5 | 198.8 | 134.4 | 108.9 | 111.9 | 125.3 |
| 2006 | 94.6 | 100.4 | 73.9 | 82.8 | 89.7 | 113.0 | 140.3 | 112.0 | 76.2 | 65.3 | 89.4 | 52.1 |
| 2007 | 302.5 | 330.0 | 300.1 | 318.0 | 345.7 | 406.9 | 424.6 | 389.3 | 340.7 | 339.3 | 290.9 | 339.2 |
| 2008 | 300.7 | 313.3 | 274.4 | 271.1 | 336.3 | 326.7 | 378.3 | 398.7 | 329.9 | 314.1 | 289.6 | 347.1 |
| 2009 | 335.5 | 295.3 | 281.8 | 331.3 | 409.3 | 413.5 | 459.4 | 401.9 | 404.2 | 325.6 | 308.0 | 366.2 |
| 2010 | 306.2 | 338.8 | 298.5 | 352.4 | 394.5 | 443.4 | 483.7 | 434.1 | 410.5 | 351.7 | 327.1 | 358.1 |
| 2011 | 335.6 | 316.4 | 262.0 | 286.7 | 330.4 | 421.0 | 430.9 | 422.7 | 354.2 | 344.0 | 344.0 | 308.4 |
| 2012 | 289.9 | 300.1 | 300.4 | 369.8 | 446.4 | 467.9 | 507.6 | 429.0 | 348.9 | 347.4 | 336.4 | 343.2 |
| 2013 | 296.9 | 327.1 | 294.3 | 305.9 | 346.8 | 417.9 | 449.7 | 422.4 | 354.2 | 386.9 | 346.7 | 373.4 |
| 2014 | 356.7 | 368.9 | 308.6 | 349.5 | 434.9 | 445.9 | 500.2 | 460.1 | 428.4 | 439.0 | 390.0 | 392.2 |
| 2015 | 351.5 | 387.4 | 361.7 | 434.3 | 512.7 | 598.5 | 674.9 | 545.8 | 504.2 | 450.3 | 431.1 | 424.4 |
| 2016 | 420.4 | 434.2 | 400.5 | 464.8 | 586.2 | 615.4 | 601.1 | 643.1 | 521.7 | 479.3 | 476.8 | 455.1 |
| 2017 | 435.9 | 413.8 | 409.4 | 458.4 | 569.9 | 680.8 | 682.7 | 637.0 | 564.2 | 543.3 | 460.0 | 461.9 |
| 2018 | 468.5 | 509.3 | 454.9 | 452.3 | 678.7 | 645.9 | 647.7 | 612.9 | 535.8 | 521.6 | 508.2 | 479.3 |
| 2019 | 566.7 | 536.9 | 486.7 | 521.6 | 644.9 | 662.3 | 755.4 | 691.5 | 564.8 | 555.2 | 544.6 | 573.8 |
| 2020 | 551.5 | 605.1 | 412.4 | 458.8 | 611.7 | 688.5 | 765.8 | 709.4 | 655.5 | 617.4 | 498.2 | 480.8 |
| 2021 | 496.6 | 551.3 | 479.5 | 567.6 | 745.3 | 783.0 | 782.3 | 698.7 | 688.4 | 619.7 | 563.2 | 562.9 |
| 2022 | 546.6 | 530.1 | 440.1 | |||||||||
| - = No Data Reported; -- = Not Applicable; NA = Not Available; W = Withheld to avoid disclosure of individual company data. |
| Release Date: 5/19/2022 |
| Next Release Date: TBD |