|
Download Data (XLS File) |
|
||||||||
|
||||||||
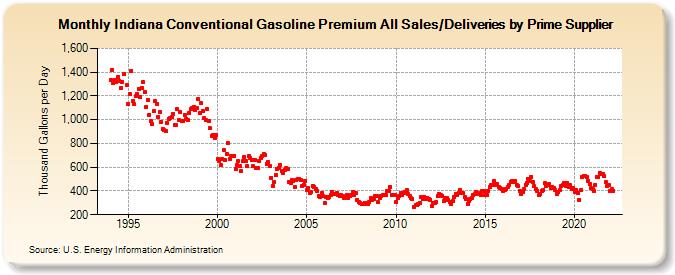
| Indiana Conventional Gasoline Premium All Sales/Deliveries by Prime Supplier (Thousand Gallons per Day) | ||||||||
| Year | Jan | Feb | Mar | Apr | May | Jun | Jul | Aug | Sep | Oct | Nov | Dec |
|---|---|---|---|---|---|---|---|---|---|---|---|---|
| 1993 | NA | NA | NA | |||||||||
| 1994 | 1,334.9 | 1,419.6 | 1,312.3 | 1,331.9 | 1,320.0 | 1,357.1 | 1,329.2 | 1,269.8 | 1,318.7 | 1,381.8 | W | 1,287.7 |
| 1995 | 1,131.1 | 1,216.6 | 1,412.4 | 1,154.3 | 1,132.9 | 1,196.6 | 1,215.9 | 1,261.5 | 1,190.2 | 1,269.8 | 1,314.8 | 1,232.5 |
| 1996 | 1,105.5 | 1,166.1 | 1,042.4 | 987.0 | 964.7 | 1,071.1 | 1,154.4 | 1,133.6 | 1,026.6 | 1,065.2 | 982.5 | 920.5 |
| 1997 | 909.8 | 907.4 | 974.8 | 1,007.6 | 1,011.4 | 1,024.0 | 1,050.2 | 959.1 | 955.6 | 1,087.1 | 993.4 | 1,062.3 |
| 1998 | 992.6 | 987.2 | 1,040.7 | 1,005.7 | 996.8 | 1,059.6 | 1,089.6 | 1,096.2 | 1,107.7 | 1,085.3 | 1,098.6 | 1,171.0 |
| 1999 | 1,056.0 | 1,139.1 | 1,069.0 | 1,011.4 | 1,000.0 | 1,088.3 | 989.3 | 926.9 | 865.6 | 870.6 | 849.8 | 869.9 |
| 2000 | 669.9 | 652.6 | 614.4 | 667.6 | 743.2 | 657.3 | 711.6 | 801.2 | 664.9 | 695.8 | 695.4 | 696.4 |
| 2001 | 580.6 | 616.9 | 648.3 | 608.2 | 568.3 | 648.2 | 682.2 | 650.9 | 607.3 | 691.6 | 678.1 | 660.6 |
| 2002 | 606.8 | 661.2 | 595.4 | 594.4 | 655.5 | 680.9 | 694.2 | 709.4 | 705.4 | 628.2 | 642.8 | 608.6 |
| 2003 | 511.9 | 442.0 | 472.2 | 532.1 | 584.2 | 595.4 | 619.8 | 566.4 | 554.7 | 579.9 | 594.0 | 583.7 |
| 2004 | 478.2 | 471.1 | 493.1 | 485.6 | 431.3 | 492.6 | 503.6 | 499.5 | 492.4 | 443.5 | 452.6 | 484.0 |
| 2005 | 409.3 | 421.9 | 382.1 | 388.4 | 444.2 | 436.0 | 418.3 | 399.7 | 357.4 | 351.8 | 383.0 | 354.4 |
| 2006 | 301.6 | 345.5 | 338.7 | 345.0 | 366.3 | 391.2 | 378.4 | 371.3 | 384.7 | 366.0 | 359.4 | 362.7 |
| 2007 | 353.9 | 338.6 | 350.0 | 369.1 | 338.7 | 358.4 | 364.5 | 389.0 | 362.2 | 381.1 | 324.8 | 310.0 |
| 2008 | 298.2 | 289.3 | 293.8 | 300.6 | 286.8 | 287.6 | 306.7 | 339.5 | 323.8 | 336.3 | 356.1 | 361.0 |
| 2009 | 303.5 | 344.5 | 357.9 | 362.6 | 368.6 | 369.8 | 399.0 | 398.8 | 437.1 | 365.6 | 368.2 | 363.3 |
| 2010 | 309.3 | 344.5 | 357.1 | 386.6 | 364.0 | 384.1 | 393.6 | 403.9 | 373.0 | 357.5 | 338.5 | 332.4 |
| 2011 | 267.5 | 278.1 | 285.4 | 287.2 | 298.6 | 347.5 | 336.1 | 352.0 | 329.4 | 344.8 | 332.6 | 326.9 |
| 2012 | 272.1 | 297.9 | 294.5 | 305.5 | 358.4 | 376.9 | 367.3 | 361.2 | 314.8 | 341.0 | 338.7 | 324.2 |
| 2013 | 305.0 | 293.8 | 311.8 | 347.3 | 374.0 | 366.2 | 380.2 | 406.5 | 378.8 | 381.2 | 347.0 | 333.5 |
| 2014 | 293.2 | 316.7 | 328.4 | 344.7 | 366.5 | 372.2 | 392.3 | 385.1 | 376.2 | 369.4 | 399.0 | 399.2 |
| 2015 | 364.2 | 367.9 | 399.8 | 434.3 | 449.0 | 451.6 | 479.6 | 446.3 | 455.8 | 431.8 | 426.6 | 418.9 |
| 2016 | 398.9 | 410.7 | 417.5 | 435.6 | 450.7 | 477.4 | 483.8 | 477.8 | 482.6 | 446.0 | 443.2 | 401.8 |
| 2017 | 370.2 | 388.0 | 414.8 | 451.2 | 465.3 | 499.0 | 481.3 | 520.3 | 472.7 | 438.4 | 416.9 | 402.7 |
| 2018 | 362.8 | 374.0 | 401.2 | 409.9 | 463.0 | 445.2 | 446.3 | 455.9 | 427.5 | 436.1 | 426.9 | 407.5 |
| 2019 | 377.3 | 388.1 | 406.4 | 438.6 | 450.8 | 468.4 | 445.0 | 464.8 | 432.4 | 446.1 | 417.2 | 423.3 |
| 2020 | 395.2 | 406.8 | 384.7 | 322.3 | 404.3 | 515.0 | 528.8 | 525.8 | 515.5 | 482.5 | 457.8 | 422.5 |
| 2021 | 414.2 | 401.5 | 453.4 | 519.7 | 514.8 | 549.9 | 545.4 | 540.3 | 522.5 | 473.8 | 444.8 | 447.1 |
| 2022 | 399.5 | 412.7 | 401.6 | |||||||||
| - = No Data Reported; -- = Not Applicable; NA = Not Available; W = Withheld to avoid disclosure of individual company data. |
| Release Date: 5/19/2022 |
| Next Release Date: TBD |