|
Download Data (XLS File) |
|
||||||||
|
||||||||
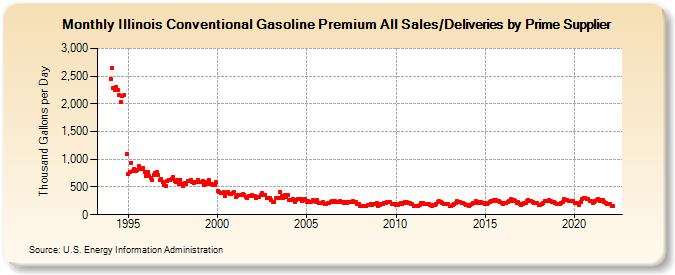
| Illinois Conventional Gasoline Premium All Sales/Deliveries by Prime Supplier (Thousand Gallons per Day) | ||||||||
| Year | Jan | Feb | Mar | Apr | May | Jun | Jul | Aug | Sep | Oct | Nov | Dec |
|---|---|---|---|---|---|---|---|---|---|---|---|---|
| 1993 | NA | NA | NA | |||||||||
| 1994 | 2,451.4 | 2,652.3 | 2,284.2 | 2,256.8 | 2,303.7 | 2,250.8 | 2,156.0 | 2,034.6 | 2,139.6 | 2,162.0 | W | 1,087.4 |
| 1995 | 739.9 | 777.0 | 933.5 | 784.5 | 829.3 | 786.9 | 812.5 | 872.1 | 829.6 | 816.6 | 842.7 | 776.3 |
| 1996 | 692.7 | 771.3 | 706.5 | 666.7 | 620.1 | 721.7 | 753.1 | 768.6 | 721.2 | 618.6 | 638.4 | 591.9 |
| 1997 | 541.5 | 524.0 | 601.7 | 633.5 | 624.9 | 637.1 | 680.9 | 601.9 | 597.5 | 628.3 | 552.6 | 631.5 |
| 1998 | 555.1 | 518.9 | 570.7 | 547.1 | 601.7 | 608.1 | 624.3 | 593.6 | 569.8 | 592.2 | 591.5 | 626.0 |
| 1999 | 590.9 | 593.2 | 600.6 | 544.4 | 551.8 | 598.2 | 629.0 | 557.7 | 545.9 | 533.0 | 542.0 | 582.8 |
| 2000 | 427.5 | 402.2 | 398.4 | 394.5 | 407.1 | 329.7 | 398.4 | 412.3 | 374.6 | 372.0 | 390.5 | 410.3 |
| 2001 | 318.5 | 339.5 | 357.4 | 360.4 | 358.9 | 366.9 | 359.8 | 327.5 | 293.2 | 342.4 | 337.6 | 347.4 |
| 2002 | 334.1 | 329.6 | 296.0 | 312.5 | 321.1 | 349.9 | 385.8 | 358.4 | 356.7 | 300.8 | 305.1 | 304.1 |
| 2003 | 264.2 | 231.3 | 237.8 | 292.5 | 305.1 | 306.5 | 409.0 | 335.1 | 306.5 | 346.7 | 325.0 | 347.5 |
| 2004 | 266.2 | 267.8 | 265.1 | 290.4 | 235.0 | 269.3 | 283.7 | 275.9 | 289.4 | 254.2 | 256.5 | 276.2 |
| 2005 | 221.6 | 242.6 | 222.3 | 232.1 | 265.8 | 246.9 | 232.1 | 260.6 | 210.2 | 212.6 | 205.7 | 224.7 |
| 2006 | 196.9 | 196.5 | 212.2 | 208.3 | 228.9 | 250.0 | 221.2 | 246.9 | 224.8 | 231.2 | 245.5 | 232.1 |
| 2007 | 232.2 | 213.5 | 233.8 | 213.5 | 230.5 | 222.6 | 231.4 | 240.4 | 226.4 | 231.0 | 196.0 | 184.7 |
| 2008 | 154.4 | 157.1 | 151.7 | 163.2 | 164.3 | 168.0 | 180.5 | 191.6 | 178.6 | 187.9 | 191.2 | 212.1 |
| 2009 | 158.4 | 173.4 | 186.0 | 199.2 | 208.7 | 214.2 | 230.5 | 222.6 | 225.5 | 199.5 | 200.2 | 201.9 |
| 2010 | 171.0 | 182.8 | 190.1 | 204.1 | 200.9 | 217.0 | 224.9 | 230.3 | 211.3 | 210.5 | 201.9 | 186.5 |
| 2011 | 148.6 | 155.7 | 153.8 | 158.7 | 173.2 | 202.4 | 216.2 | 201.5 | 193.8 | 200.6 | 188.8 | 177.4 |
| 2012 | 151.6 | 169.9 | 166.4 | 195.5 | 222.7 | 242.7 | 233.5 | 213.3 | 187.9 | 196.8 | 193.4 | 185.6 |
| 2013 | 161.9 | 155.2 | 166.7 | 190.7 | 210.1 | 240.6 | 223.0 | 232.4 | 211.3 | 207.0 | 190.8 | 183.7 |
| 2014 | 167.5 | 165.8 | 170.4 | 199.3 | 214.7 | 211.1 | 246.3 | 229.4 | 217.0 | 230.2 | 210.0 | 210.1 |
| 2015 | 189.5 | 190.4 | 205.4 | 235.4 | 244.5 | 248.1 | 268.6 | 265.0 | 255.4 | 241.8 | 221.9 | 212.0 |
| 2016 | 195.4 | 202.4 | 204.5 | 226.8 | 244.2 | 279.9 | 252.0 | 262.0 | 249.1 | 215.3 | 222.9 | 200.1 |
| 2017 | 172.1 | 186.4 | 204.7 | 219.3 | 247.3 | 268.2 | 247.6 | 250.5 | 233.8 | 216.1 | 206.9 | 202.5 |
| 2018 | 177.5 | 175.6 | 200.1 | 207.4 | 255.6 | 247.2 | 248.7 | 257.6 | 240.9 | 229.4 | 230.8 | 220.3 |
| 2019 | 193.4 | 186.0 | 196.1 | 209.0 | 238.3 | 286.8 | 266.3 | 269.9 | 253.4 | 254.6 | 240.5 | 243.4 |
| 2020 | 217.3 | 219.3 | 212.8 | 177.9 | 231.4 | 286.3 | 301.3 | 300.3 | 282.2 | 274.9 | 248.6 | 241.3 |
| 2021 | 218.7 | 228.6 | 246.4 | 274.4 | 284.7 | 247.8 | 258.4 | 258.0 | 234.8 | 206.5 | 194.3 | 190.1 |
| 2022 | 195.2 | 163.9 | 163.7 | |||||||||
| - = No Data Reported; -- = Not Applicable; NA = Not Available; W = Withheld to avoid disclosure of individual company data. |
| Release Date: 5/19/2022 |
| Next Release Date: TBD |