|
Download Data (XLS File) |
|
||||||||
|
||||||||
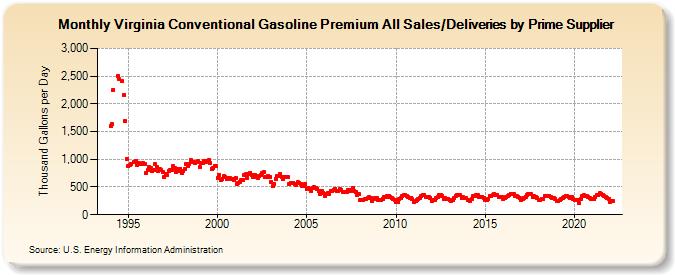
| Virginia Conventional Gasoline Premium All Sales/Deliveries by Prime Supplier (Thousand Gallons per Day) | ||||||||
| Year | Jan | Feb | Mar | Apr | May | Jun | Jul | Aug | Sep | Oct | Nov | Dec |
|---|---|---|---|---|---|---|---|---|---|---|---|---|
| 1993 | NA | NA | NA | |||||||||
| 1994 | 1,593.5 | 1,628.6 | 2,253.6 | W | W | 2,500.6 | 2,447.5 | W | 2,403.9 | 2,156.4 | 1,682.0 | 1,004.2 |
| 1995 | 873.8 | 890.1 | 920.1 | W | 945.8 | 961.9 | 899.9 | 935.4 | 907.7 | 913.4 | 928.9 | 910.1 |
| 1996 | 753.8 | 807.5 | 852.7 | 833.8 | 781.8 | 798.0 | 906.2 | 864.4 | 791.5 | 818.5 | 804.6 | 767.9 |
| 1997 | 683.8 | 736.5 | 718.5 | 786.1 | 813.9 | 811.2 | 873.5 | 845.9 | 776.9 | 823.4 | 796.4 | 830.4 |
| 1998 | 752.0 | 786.6 | 824.3 | 908.2 | 883.5 | 912.3 | 983.5 | 947.5 | 955.8 | 935.4 | 946.7 | 966.7 |
| 1999 | 859.6 | 925.6 | 936.3 | 961.8 | 945.2 | 974.6 | 986.0 | 933.7 | 833.0 | 850.6 | 883.5 | 886.2 |
| 2000 | 666.6 | 721.4 | 631.7 | 644.2 | 690.5 | 678.2 | 649.7 | 669.2 | 654.8 | 648.6 | 640.6 | 624.6 |
| 2001 | 664.9 | 555.4 | 578.4 | 596.2 | 623.2 | 632.9 | 709.9 | 729.0 | 669.0 | 742.7 | 758.3 | 711.8 |
| 2002 | 686.1 | 724.6 | 675.2 | 662.8 | 704.7 | 711.8 | 751.6 | 764.9 | 680.9 | 679.2 | 693.9 | 688.3 |
| 2003 | 586.4 | 512.1 | 560.3 | 641.8 | 698.1 | 689.9 | 735.1 | 689.0 | 643.4 | 685.5 | 677.1 | 676.3 |
| 2004 | 558.7 | 572.0 | 580.7 | 578.9 | 548.8 | 535.2 | 586.1 | 570.4 | 559.8 | 510.1 | 525.9 | 558.0 |
| 2005 | 459.4 | 482.3 | 455.0 | 434.9 | 484.8 | 492.5 | 490.3 | 466.4 | 422.4 | 376.2 | 433.4 | 399.1 |
| 2006 | 342.4 | 381.9 | 394.4 | 376.0 | 436.2 | 428.1 | 451.5 | 470.4 | 427.4 | 435.0 | 460.3 | 447.1 |
| 2007 | 418.7 | 417.8 | 418.2 | 413.4 | 442.9 | 430.2 | 454.5 | 480.4 | 427.7 | 415.7 | 357.0 | 366.7 |
| 2008 | 263.2 | 274.0 | 268.1 | 281.0 | 291.4 | 293.2 | 313.9 | 301.3 | 250.8 | 288.7 | 293.1 | 299.1 |
| 2009 | 257.1 | 260.3 | 263.4 | 289.1 | 317.7 | 316.6 | 346.4 | 335.2 | 321.3 | 306.1 | 277.5 | 269.6 |
| 2010 | 236.7 | 231.4 | 276.9 | 299.0 | 332.3 | 349.4 | 351.8 | 334.3 | 312.3 | 309.8 | 306.6 | 277.7 |
| 2011 | 226.8 | 251.3 | 263.6 | 284.5 | 302.3 | 335.4 | 351.9 | 357.7 | 326.0 | 311.4 | 320.0 | 310.3 |
| 2012 | 242.6 | 269.1 | 267.7 | 296.4 | 319.3 | 350.2 | 356.0 | 333.9 | 289.5 | 306.1 | 292.3 | 286.5 |
| 2013 | 264.5 | 253.5 | 271.9 | 304.1 | 340.4 | 352.9 | 358.2 | 363.3 | 308.7 | 311.2 | 305.5 | 307.0 |
| 2014 | 259.9 | 265.5 | 255.4 | 290.1 | 332.7 | 337.2 | 347.8 | 354.1 | 312.4 | 319.6 | 323.6 | 304.7 |
| 2015 | 272.0 | 258.9 | 291.9 | 342.8 | 338.4 | 360.6 | 373.9 | 361.3 | 352.3 | 325.1 | 326.7 | 317.7 |
| 2016 | 278.2 | 298.0 | 324.0 | 333.1 | 352.2 | 381.0 | 369.2 | 369.6 | 332.5 | 335.2 | 326.7 | 300.3 |
| 2017 | 258.9 | 277.6 | 303.6 | 325.9 | 356.4 | 368.3 | 365.8 | 366.4 | 322.3 | 329.1 | 323.1 | 302.2 |
| 2018 | 264.5 | 259.7 | 289.1 | 287.4 | 341.9 | 334.8 | 340.0 | 342.2 | 312.8 | 306.3 | 304.4 | 283.3 |
| 2019 | 255.2 | 247.4 | 258.1 | 287.4 | 310.3 | 326.7 | 341.2 | 334.7 | 316.3 | 310.0 | 312.8 | 290.8 |
| 2020 | 263.1 | 261.0 | 269.9 | 205.1 | 284.4 | 345.8 | 350.3 | 341.5 | 339.8 | 327.1 | 303.7 | 288.4 |
| 2021 | 289.9 | 275.6 | 312.9 | 348.3 | 362.1 | 384.5 | 373.9 | 361.0 | 333.5 | 320.3 | 297.8 | 292.3 |
| 2022 | 234.0 | 245.0 | 239.4 | |||||||||
| - = No Data Reported; -- = Not Applicable; NA = Not Available; W = Withheld to avoid disclosure of individual company data. |
| Release Date: 5/19/2022 |
| Next Release Date: TBD |