|
Download Data (XLS File) |
|
||||||||
|
||||||||
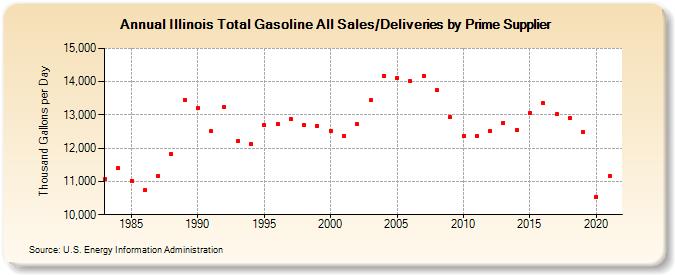
| Illinois Total Gasoline All Sales/Deliveries by Prime Supplier (Thousand Gallons per Day) | ||||||||
| Decade | Year-0 | Year-1 | Year-2 | Year-3 | Year-4 | Year-5 | Year-6 | Year-7 | Year-8 | Year-9 |
|---|---|---|---|---|---|---|---|---|---|---|
| 1980's | 11,068.5 | 11,398.2 | 11,022.5 | 10,738.3 | 11,172.8 | 11,829.2 | 13,449.8 | |||
| 1990's | 13,209.5 | 12,513.9 | 13,233.8 | 12,209.6 | 12,120.5 | 12,700.3 | 12,734.6 | 12,870.1 | 12,701.5 | 12,669.2 |
| 2000's | 12,526.1 | 12,361.4 | 12,712.5 | 13,435.0 | 14,184.5 | 14,115.4 | 14,008.7 | 14,180.1 | 13,735.8 | 12,933.2 |
| 2010's | 12,356.6 | 12,378.1 | 12,523.6 | 12,769.1 | 12,553.2 | 13,052.1 | 13,348.7 | 13,017.8 | 12,896.2 | 12,481.3 |
| 2020's | 10,544.3 |
| - = No Data Reported; -- = Not Applicable; NA = Not Available; W = Withheld to avoid disclosure of individual company data. |
| Release Date: 6/1/2022 |
| Next Release Date: TBD |