|
Download Data (XLS File) |
|
||||||||
|
||||||||
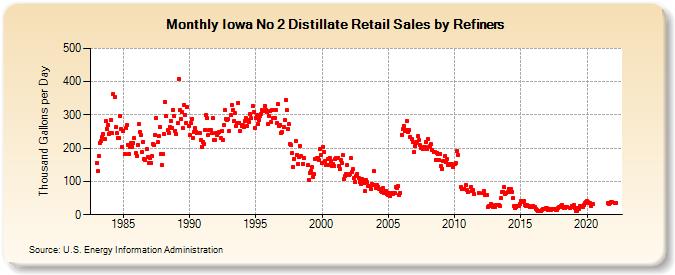
| Iowa No 2 Distillate Retail Sales by Refiners (Thousand Gallons per Day) | ||||||||
| Year | Jan | Feb | Mar | Apr | May | Jun | Jul | Aug | Sep | Oct | Nov | Dec |
|---|---|---|---|---|---|---|---|---|---|---|---|---|
| 1983 | 156.0 | 130.7 | 177.5 | 215.2 | 221.1 | 233.0 | 241.9 | 226.3 | 280.6 | 258.7 | 268.4 | 242.5 |
| 1984 | 246.0 | 284.2 | 244.4 | 362.3 | 352.5 | 262.2 | 245.6 | 231.4 | 230.1 | 296.4 | 258.5 | 203.2 |
| 1985 | 251.4 | 183.0 | 259.8 | 268.7 | 210.7 | 183.5 | 203.5 | 214.8 | 204.7 | 216.7 | 229.7 | 184.5 |
| 1986 | 178.0 | 208.9 | 271.6 | 249.1 | 239.7 | 189.1 | 219.7 | 166.5 | 163.8 | 196.5 | 173.2 | 155.3 |
| 1987 | 171.5 | 155.1 | 175.5 | 212.4 | 209.5 | 240.7 | 291.4 | 217.8 | 235.2 | 262.2 | 182.3 | 149.0 |
| 1988 | 181.3 | 241.3 | 339.1 | 295.9 | 254.5 | 244.6 | 263.7 | 282.5 | 261.5 | 316.2 | 296.4 | 252.0 |
| 1989 | 242.3 | 275.5 | 408.9 | 314.6 | 288.6 | 307.5 | 259.3 | 330.8 | 299.2 | 276.8 | 323.3 | 268.1 |
| 1990 | 238.5 | 275.1 | 288.5 | 229.4 | 249.1 | 260.1 | 249.3 | 245.5 | 246.5 | 245.8 | 224.5 | 204.2 |
| 1991 | 219.5 | 212.2 | 255.5 | 300.6 | 289.9 | 239.7 | 254.5 | 255.5 | 244.5 | 289.4 | 225.1 | 226.0 |
| 1992 | 244.8 | 239.6 | 246.8 | 247.8 | 230.1 | 252.8 | 225.7 | 269.5 | 314.9 | 288.3 | 285.5 | 286.4 |
| 1993 | 252.7 | 298.3 | 330.5 | 313.9 | 280.8 | 306.5 | 265.5 | 276.9 | 336.8 | 276.6 | 251.0 | 266.2 |
| 1994 | 270.9 | 264.5 | 282.5 | 290.2 | 267.4 | 286.0 | 279.2 | 301.7 | 289.4 | 326.4 | 308.1 | 261.3 |
| 1995 | 290.6 | 299.4 | 272.4 | 285.0 | 298.2 | 303.6 | 314.5 | 311.7 | 327.0 | 314.2 | 307.7 | 272.3 |
| 1996 | 295.6 | 313.0 | 277.7 | 316.0 | 291.6 | 292.1 | 315.1 | 276.1 | 332.7 | 267.6 | 270.2 | 247.0 |
| 1997 | 247.8 | 262.7 | 285.1 | 345.4 | 314.1 | 257.8 | 271.9 | 212.6 | 209.5 | 185.3 | 143.5 | 168.1 |
| 1998 | 221.5 | 179.3 | 153.6 | 172.8 | 205.4 | 176.3 | NA | 153.4 | 170.4 | W | NA | 148.5 |
| 1999 | 105.0 | 126.4 | 132.0 | 142.2 | 114.3 | 122.3 | 168.0 | 169.3 | 170.7 | 164.9 | 196.1 | 179.8 |
| 2000 | 155.3 | 204.6 | 188.3 | 162.3 | 150.7 | 166.9 | 150.7 | 171.3 | 160.4 | 146.9 | 151.3 | 146.8 |
| 2001 | 167.3 | 171.2 | 170.9 | 146.2 | 137.6 | 164.4 | 156.2 | 178.3 | 107.4 | 116.5 | 123.2 | 148.6 |
| 2002 | 120.4 | 121.7 | 170.6 | 127.8 | 136.5 | 109.1 | 97.6 | 115.0 | 123.3 | 109.5 | 98.2 | 93.6 |
| 2003 | 107.9 | 105.0 | 94.4 | 70.1 | 102.9 | 97.3 | 86.1 | 85.0 | 76.6 | 93.3 | 87.9 | 130.0 |
| 2004 | 88.8 | 81.1 | 88.2 | 83.9 | 78.1 | 72.1 | 69.6 | 79.4 | 65.3 | 65.9 | 71.2 | 62.9 |
| 2005 | 58.5 | 64.6 | 55.3 | 66.7 | 62.2 | 65.8 | 64.5 | 83.0 | 81.8 | 85.4 | 58.4 | 66.6 |
| 2006 | 241.0 | 257.5 | 266.2 | 252.9 | 253.2 | 281.8 | 248.2 | 253.6 | 233.8 | 228.5 | 218.7 | 188.5 |
| 2007 | 205.1 | 216.4 | 219.3 | 235.3 | 224.0 | 208.6 | 200.7 | 196.3 | 203.9 | 204.9 | 217.7 | 198.6 |
| 2008 | 227.0 | 204.0 | 206.6 | 211.6 | 195.3 | 188.0 | 189.0 | 165.6 | 186.3 | 181.3 | 163.6 | 183.9 |
| 2009 | 146.6 | 138.6 | 161.5 | 175.2 | 158.0 | 166.3 | 148.7 | 151.4 | 152.9 | 153.4 | 149.9 | 143.4 |
| 2010 | 151.3 | 154.1 | 190.2 | 181.0 | NA | NA | 82.6 | 76.9 | 76.5 | 78.8 | 88.9 | 73.2 |
| 2011 | 66.8 | W | W | 84.3 | 72.1 | 74.8 | 62.1 | W | W | W | 64.8 | W |
| 2012 | W | W | 64.7 | 71.2 | 60.4 | 59.1 | 23.7 | 26.5 | 26.5 | 32.4 | 28.9 | 23.4 |
| 2013 | 27.3 | 23.6 | 28.3 | 28.8 | 29.5 | 25.7 | 49.4 | 68.6 | 69.7 | 82.5 | 62.3 | 64.4 |
| 2014 | 68.8 | 77.4 | 67.8 | 77.6 | 69.5 | 50.9 | 25.4 | 18.9 | 23.0 | 27.5 | 25.0 | 33.5 |
| 2015 | 40.6 | 37.2 | 37.8 | 39.9 | 28.5 | 27.5 | 28.6 | 27.3 | 24.2 | 22.7 | 22.3 | 26.2 |
| 2016 | 22.7 | 22.0 | 18.6 | 13.4 | 11.5 | 11.7 | 12.0 | 14.8 | 16.7 | 16.8 | 15.7 | 21.4 |
| 2017 | 18.7 | 15.5 | 16.6 | 13.7 | 16.1 | 15.8 | 15.7 | 16.5 | 15.0 | 15.0 | 18.7 | 23.8 |
| 2018 | 27.0 | 29.6 | 22.3 | 21.4 | 21.5 | 23.7 | 23.5 | W | W | 19.6 | 26.6 | 23.3 |
| 2019 | 28.9 | 18.8 | 12.0 | 12.0 | 20.1 | 18.1 | 26.5 | 25.9 | 24.2 | 29.3 | 33.9 | 38.4 |
| 2020 | 39.9 | 37.6 | 36.3 | 34.1 | 26.9 | 31.2 | W | W | W | W | W | W |
| 2021 | W | W | W | W | W | W | W | 33.8 | 32.3 | 34.5 | 37.1 | 36.9 |
| 2022 | W | 35.4 | 36.5 | |||||||||
| - = No Data Reported; -- = Not Applicable; NA = Not Available; W = Withheld to avoid disclosure of individual company data. |
| Release Date: 6/1/2022 |
| Next Release Date: TBD |