|
Download Data (XLS File) |
|
||||||||
|
||||||||
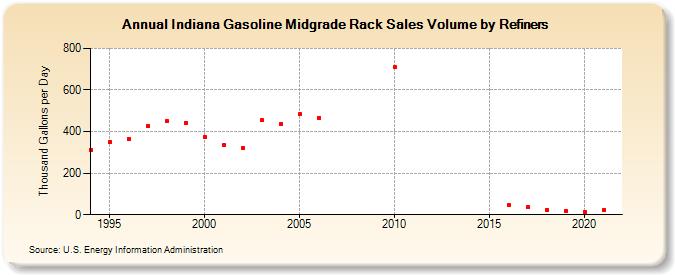
| Indiana Gasoline Midgrade Rack Sales Volume by Refiners (Thousand Gallons per Day) | ||||||||
| Decade | Year-0 | Year-1 | Year-2 | Year-3 | Year-4 | Year-5 | Year-6 | Year-7 | Year-8 | Year-9 |
|---|---|---|---|---|---|---|---|---|---|---|
| 1990's | 313.2 | 350.8 | 366.1 | 425.7 | 449.8 | 442.8 | ||||
| 2000's | 375.1 | 335.8 | 323.0 | 455.4 | 436.1 | 482.1 | 467.0 | W | W | W |
| 2010's | 708.2 | W | W | W | W | W | 46.0 | 36.2 | 23.9 | 18.9 |
| 2020's | 13.7 |
| - = No Data Reported; -- = Not Applicable; NA = Not Available; W = Withheld to avoid disclosure of individual company data. |
| Release Date: 6/1/2022 |
| Next Release Date: TBD |