|
Download Data (XLS File) |
|
||||||||
|
||||||||
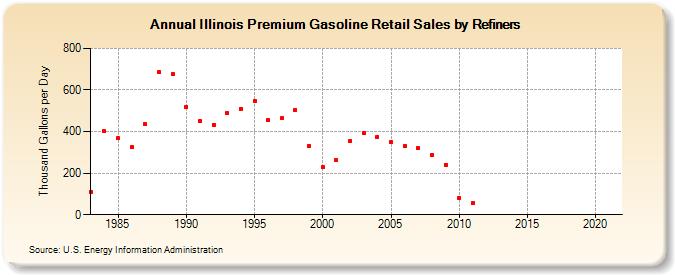
| Illinois Premium Gasoline Retail Sales by Refiners (Thousand Gallons per Day) | ||||||||
| Decade | Year-0 | Year-1 | Year-2 | Year-3 | Year-4 | Year-5 | Year-6 | Year-7 | Year-8 | Year-9 |
|---|---|---|---|---|---|---|---|---|---|---|
| 1980's | 111.5 | 401.2 | 366.7 | 325.4 | 434.2 | 686.3 | 675.0 | |||
| 1990's | 520.3 | 450.7 | 433.5 | 488.6 | 509.7 | 546.8 | 454.6 | 463.9 | 505.7 | 330.7 |
| 2000's | 227.1 | 260.9 | 354.1 | 392.2 | 376.0 | 349.4 | 328.5 | 320.4 | 286.7 | 240.9 |
| 2010's | 80.7 | 55.4 | W | W | W | W | W | W | W | W |
| 2020's | W |
| - = No Data Reported; -- = Not Applicable; NA = Not Available; W = Withheld to avoid disclosure of individual company data. |
| Release Date: 6/1/2022 |
| Next Release Date: TBD |