|
Download Data (XLS File) |
|
||||||||
|
||||||||
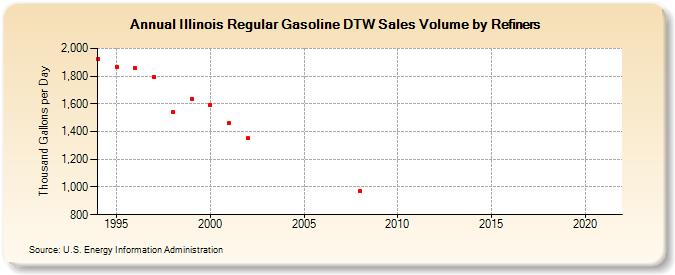
| Illinois Regular Gasoline DTW Sales Volume by Refiners (Thousand Gallons per Day) | ||||||||
| Decade | Year-0 | Year-1 | Year-2 | Year-3 | Year-4 | Year-5 | Year-6 | Year-7 | Year-8 | Year-9 |
|---|---|---|---|---|---|---|---|---|---|---|
| 1990's | 1,920.5 | 1,865.9 | 1,855.4 | 1,795.3 | 1,540.6 | 1,634.5 | ||||
| 2000's | 1,592.2 | 1,460.4 | 1,350.4 | W | W | W | W | W | 968.8 | W |
| 2010's | W | W | W | W | - | - | - | - | - | - |
| 2020's | - |
| - = No Data Reported; -- = Not Applicable; NA = Not Available; W = Withheld to avoid disclosure of individual company data. |
| Release Date: 6/1/2022 |
| Next Release Date: TBD |