|
Download Data (XLS File) |
|
||||||||
|
||||||||
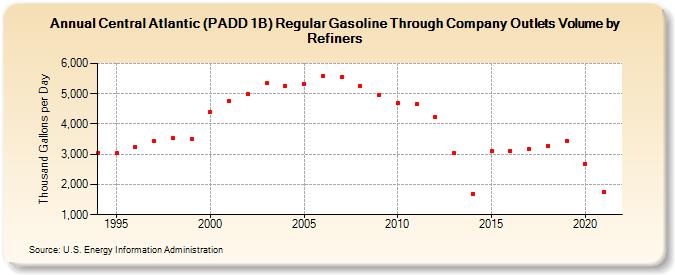
| Central Atlantic (PADD 1B) Regular Gasoline Through Company Outlets Volume by Refiners (Thousand Gallons per Day) | ||||||||
| Decade | Year-0 | Year-1 | Year-2 | Year-3 | Year-4 | Year-5 | Year-6 | Year-7 | Year-8 | Year-9 |
|---|---|---|---|---|---|---|---|---|---|---|
| 1990's | 3,026.1 | 3,030.8 | 3,254.0 | 3,436.8 | 3,523.7 | 3,509.8 | ||||
| 2000's | 4,401.7 | 4,758.7 | 4,980.1 | 5,346.1 | 5,264.2 | 5,329.0 | 5,592.6 | 5,560.3 | 5,254.9 | 4,973.8 |
| 2010's | 4,678.3 | 4,654.2 | 4,225.5 | 3,027.4 | 1,697.1 | 3,099.0 | 3,099.8 | 3,170.8 | 3,271.4 | 3,451.7 |
| 2020's | 2,677.5 |
| - = No Data Reported; -- = Not Applicable; NA = Not Available; W = Withheld to avoid disclosure of individual company data. |
| Release Date: 6/1/2022 |
| Next Release Date: TBD |