|
Download Data (XLS File) |
|
||||||||
|
||||||||
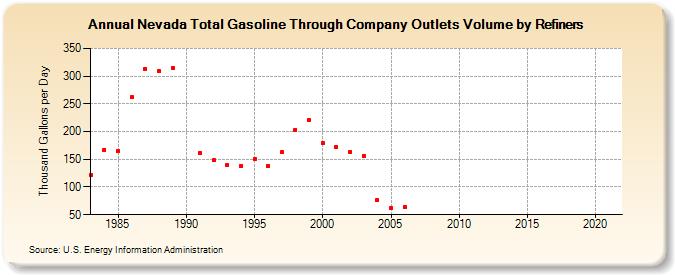
| Nevada Total Gasoline Through Company Outlets Volume by Refiners (Thousand Gallons per Day) | ||||||||
| Decade | Year-0 | Year-1 | Year-2 | Year-3 | Year-4 | Year-5 | Year-6 | Year-7 | Year-8 | Year-9 |
|---|---|---|---|---|---|---|---|---|---|---|
| 1980's | 121.4 | 167.2 | 165.2 | 261.8 | 312.6 | 308.8 | 315.3 | |||
| 1990's | W | 161.9 | 148.1 | 139.5 | 137.9 | 150.1 | 137.7 | 162.5 | 203.6 | 221.6 |
| 2000's | 179.2 | 171.9 | 164.0 | 155.8 | 76.4 | 63.0 | 64.2 | W | W | W |
| 2010's | W | W | W | W | W | W | W | W | W | W |
| 2020's | W |
| - = No Data Reported; -- = Not Applicable; NA = Not Available; W = Withheld to avoid disclosure of individual company data. |
| Release Date: 6/1/2022 |
| Next Release Date: TBD |