|
Download Data (XLS File) |
|
||||||||
|
||||||||
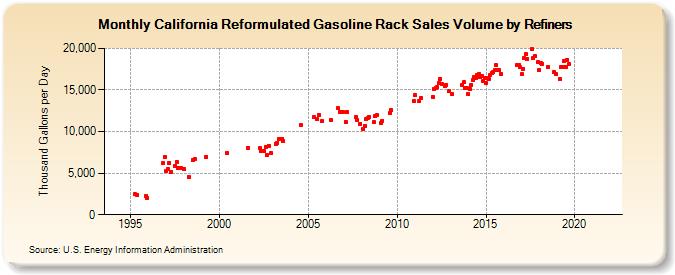
| California Reformulated Gasoline Rack Sales Volume by Refiners (Thousand Gallons per Day) | ||||||||
| Year | Jan | Feb | Mar | Apr | May | Jun | Jul | Aug | Sep | Oct | Nov | Dec |
|---|---|---|---|---|---|---|---|---|---|---|---|---|
| 1994 | - | - | - | - | - | - | - | - | - | - | W | W |
| 1995 | W | W | W | 2,435.1 | 2,396.5 | W | W | W | W | W | 2,260.7 | 2,025.3 |
| 1996 | W | W | W | W | W | W | W | W | W | W | 6,163.2 | 6,955.3 |
| 1997 | 5,207.0 | 5,508.3 | 6,266.8 | 5,194.4 | W | W | 5,895.2 | 6,387.3 | 5,596.9 | W | 5,614.5 | W |
| 1998 | 5,495.1 | W | W | 4,541.8 | W | W | 6,638.2 | 6,689.9 | W | W | W | W |
| 1999 | W | W | W | 6,944.9 | W | W | W | W | W | W | W | W |
| 2000 | W | W | W | W | W | 7,441.2 | W | W | W | W | W | W |
| 2001 | W | W | W | W | W | W | W | 8,071.9 | W | W | W | W |
| 2002 | W | W | W | 7,983.8 | 7,616.9 | W | 7,669.1 | 8,142.9 | 7,193.5 | 8,295.0 | W | 7,415.7 |
| 2003 | W | W | 8,531.5 | 8,658.1 | 9,099.0 | W | 9,142.0 | 8,836.9 | W | W | W | W |
| 2004 | W | W | W | W | W | W | W | 10,728.3 | W | W | W | W |
| 2005 | W | W | W | W | 11,759.6 | W | 11,483.0 | 11,992.2 | W | 11,236.3 | W | W |
| 2006 | W | W | W | 11,442.4 | W | W | W | W | 12,786.0 | 12,363.4 | W | 12,344.5 |
| 2007 | W | 11,195.8 | 12,359.5 | W | W | W | W | W | 11,698.6 | 11,396.5 | W | 10,961.9 |
| 2008 | W | 10,254.0 | 10,708.0 | 11,494.6 | 11,600.5 | 11,743.5 | W | W | 11,113.7 | 11,812.0 | 11,973.3 | W |
| 2009 | W | 11,002.5 | 11,302.8 | W | W | W | W | 12,237.5 | 12,538.5 | W | W | W |
| 2010 | W | W | W | W | W | W | W | W | W | W | W | 13,696.9 |
| 2011 | 14,376.2 | W | W | 13,693.2 | 14,045.8 | W | W | W | W | W | W | W |
| 2012 | 14,184.3 | 15,121.9 | 15,247.9 | 15,337.9 | 15,837.9 | 16,346.5 | 15,720.4 | W | 15,483.6 | 15,630.6 | W | 14,820.5 |
| 2013 | W | 14,458.3 | W | W | W | W | W | W | 15,651.3 | 15,902.0 | 15,206.8 | 15,221.7 |
| 2014 | 14,501.7 | 15,084.0 | 15,629.5 | 16,201.4 | 16,516.3 | 16,411.3 | 16,786.3 | 16,900.8 | 16,506.0 | 16,723.8 | 16,103.3 | 16,461.8 |
| 2015 | 15,809.6 | 16,391.8 | 16,272.4 | 16,835.2 | 17,062.8 | 17,212.5 | 17,379.3 | 17,964.1 | 17,407.9 | 17,410.5 | 16,907.6 | W |
| 2016 | W | W | W | W | W | W | W | W | W | 17,991.7 | 18,049.5 | 17,719.7 |
| 2017 | 16,868.0 | 17,572.5 | 18,866.8 | 19,286.6 | 18,735.1 | W | W | 19,875.4 | 18,889.0 | 19,032.7 | W | 18,348.4 |
| 2018 | 17,400.9 | 18,209.4 | 18,160.5 | W | W | W | 17,797.0 | W | W | W | 17,100.9 | 16,945.8 |
| 2019 | W | W | 16,294.4 | 17,751.5 | 17,802.3 | 18,538.5 | 17,762.5 | 18,609.4 | 18,140.3 | W | W | W |
| 2020 | W | W | W | W | W | W | W | W | W | W | W | W |
| 2021 | W | W | W | W | W | W | W | W | W | W | W | W |
| 2022 | W | W | W | |||||||||
| - = No Data Reported; -- = Not Applicable; NA = Not Available; W = Withheld to avoid disclosure of individual company data. |
| Release Date: 6/1/2022 |
| Next Release Date: TBD |