|
Download Data (XLS File) |
|
||||||||
|
||||||||
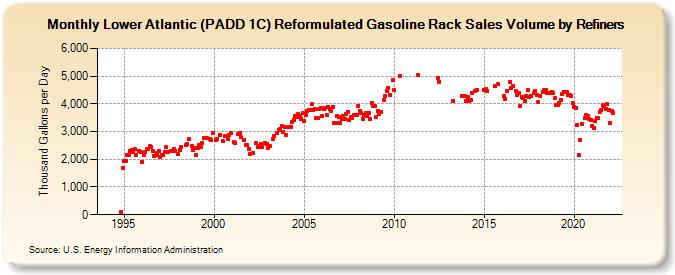
| Lower Atlantic (PADD 1C) Reformulated Gasoline Rack Sales Volume by Refiners (Thousand Gallons per Day) | ||||||||
| Year | Jan | Feb | Mar | Apr | May | Jun | Jul | Aug | Sep | Oct | Nov | Dec |
|---|---|---|---|---|---|---|---|---|---|---|---|---|
| 1994 | - | - | - | - | - | - | - | - | - | - | 114.8 | 1,701.8 |
| 1995 | 1,925.7 | 1,934.9 | 2,170.9 | 2,157.6 | 2,307.6 | 2,347.3 | 2,257.2 | 2,356.9 | 2,138.3 | W | 2,300.9 | 2,275.6 |
| 1996 | 1,903.6 | 2,151.1 | 2,254.0 | 2,371.8 | 2,383.2 | 2,483.7 | 2,451.1 | 2,306.1 | 2,106.8 | 2,142.6 | 2,240.1 | 2,287.5 |
| 1997 | 2,087.8 | 2,165.7 | 2,165.9 | 2,271.7 | 2,427.5 | 2,247.2 | W | 2,312.6 | 2,286.8 | 2,384.9 | 2,314.8 | W |
| 1998 | 2,187.4 | 2,344.1 | 2,425.4 | W | W | 2,510.8 | 2,559.1 | 2,714.6 | W | 2,484.4 | 2,349.0 | 2,415.9 |
| 1999 | 2,154.7 | 2,393.9 | 2,519.9 | 2,428.3 | 2,599.8 | 2,782.0 | W | 2,749.5 | W | 2,727.9 | 2,681.7 | 2,964.9 |
| 2000 | W | 2,709.3 | 2,736.8 | W | 2,878.0 | W | 2,664.6 | 2,838.9 | W | 2,715.4 | 2,883.3 | 2,935.0 |
| 2001 | W | 2,612.7 | 2,593.1 | W | 2,903.2 | 2,950.7 | 2,791.0 | W | 2,679.3 | 2,498.7 | 2,500.3 | 2,383.9 |
| 2002 | 2,177.5 | W | 2,242.3 | W | 2,570.6 | 2,433.0 | 2,477.6 | 2,551.0 | 2,438.0 | W | 2,577.9 | 2,564.4 |
| 2003 | 2,424.4 | 2,480.9 | W | 2,718.6 | 2,838.5 | W | 2,950.0 | 3,067.5 | 3,088.5 | 3,183.5 | 2,984.0 | 3,167.9 |
| 2004 | 2,892.3 | W | 3,164.2 | 3,180.6 | 3,357.4 | 3,430.9 | 3,574.8 | 3,530.3 | 3,634.0 | 3,565.5 | 3,459.5 | 3,663.4 |
| 2005 | 3,366.3 | 3,579.8 | 3,728.0 | 3,771.8 | 3,764.4 | 3,983.1 | 3,784.8 | 3,824.5 | 3,474.7 | 3,498.7 | 3,826.4 | 3,834.2 |
| 2006 | 3,576.3 | 3,799.6 | 3,834.0 | 3,611.2 | 3,885.4 | 3,801.3 | 3,725.9 | 3,898.7 | 3,323.0 | 3,294.2 | 3,559.4 | 3,513.6 |
| 2007 | 3,325.2 | 3,469.9 | 3,564.4 | 3,438.6 | 3,625.7 | 3,709.6 | 3,434.1 | 3,530.2 | 3,483.5 | 3,593.2 | 3,607.7 | 3,596.0 |
| 2008 | 3,937.9 | 3,757.6 | 3,664.3 | 3,457.5 | 3,612.9 | 3,676.0 | 3,569.1 | 3,669.6 | 3,458.1 | 4,036.6 | 3,937.9 | 3,910.4 |
| 2009 | 3,534.2 | 3,726.9 | 3,621.5 | 3,706.9 | W | 4,131.3 | 4,279.0 | 4,448.5 | 4,571.1 | 4,308.8 | W | 4,843.8 |
| 2010 | 4,483.2 | W | W | NA | 4,989.2 | W | W | W | W | W | W | W |
| 2011 | W | W | W | NA | 5,041.5 | W | W | W | W | W | W | W |
| 2012 | W | W | W | W | W | 4,930.3 | 4,794.3 | W | W | W | W | W |
| 2013 | W | W | W | 4,097.8 | W | W | W | W | W | 4,292.0 | 4,288.7 | 4,284.3 |
| 2014 | 4,117.1 | 4,259.5 | 4,087.5 | 4,121.5 | 4,387.3 | W | 4,462.9 | 4,503.5 | W | W | W | W |
| 2015 | 4,496.2 | 4,519.5 | 4,479.2 | W | W | W | W | 4,625.5 | W | 4,722.4 | W | W |
| 2016 | W | 4,292.4 | 4,191.6 | 4,447.1 | W | 4,787.8 | 4,562.7 | 4,635.1 | W | 4,474.0 | 4,304.7 | 4,388.3 |
| 2017 | 3,937.6 | 4,231.1 | 4,198.3 | 4,097.2 | 4,283.6 | 4,491.5 | 4,262.6 | 4,274.8 | W | 4,381.7 | 4,465.9 | 4,312.7 |
| 2018 | 4,064.0 | 4,264.6 | W | 4,439.7 | 4,517.0 | 4,487.3 | 4,407.1 | W | 4,405.6 | 4,413.0 | 4,373.7 | 4,206.2 |
| 2019 | 3,940.9 | 3,954.5 | 4,037.1 | 4,150.0 | 4,368.6 | 4,444.3 | W | 4,444.2 | 4,335.4 | 4,326.5 | 4,284.9 | 4,039.3 |
| 2020 | 3,874.8 | 3,865.3 | 3,251.0 | 2,156.8 | 2,679.4 | 3,281.9 | W | 3,492.0 | 3,595.2 | 3,564.4 | 3,445.9 | 3,405.2 |
| 2021 | 3,199.9 | 3,138.1 | 3,379.4 | 3,502.6 | 3,486.4 | 3,712.9 | 3,763.6 | 3,969.6 | 3,902.8 | 3,828.9 | 3,987.5 | 3,779.0 |
| 2022 | 3,313.8 | 3,756.1 | 3,682.0 | |||||||||
| - = No Data Reported; -- = Not Applicable; NA = Not Available; W = Withheld to avoid disclosure of individual company data. |
| Release Date: 6/1/2022 |
| Next Release Date: TBD |