|
Download Data (XLS File) |
|
||||||||
|
||||||||
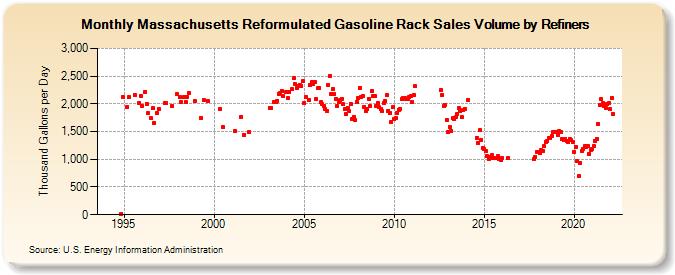
| Massachusetts Reformulated Gasoline Rack Sales Volume by Refiners (Thousand Gallons per Day) | ||||||||
| Year | Jan | Feb | Mar | Apr | May | Jun | Jul | Aug | Sep | Oct | Nov | Dec |
|---|---|---|---|---|---|---|---|---|---|---|---|---|
| 1994 | - | - | - | - | - | - | - | - | - | - | 16.4 | 2,128.3 |
| 1995 | W | W | 1,940.3 | 2,115.8 | W | W | W | 2,164.2 | W | W | 2,021.9 | 2,148.4 |
| 1996 | 1,965.1 | W | 2,221.9 | 2,000.1 | 1,833.5 | W | 1,735.8 | 1,915.8 | 1,657.3 | W | 1,843.3 | 1,913.8 |
| 1997 | W | W | W | 2,016.8 | 2,006.4 | W | W | W | 1,960.4 | W | W | 2,176.1 |
| 1998 | W | 2,117.3 | 2,032.4 | W | 2,127.9 | 2,037.3 | 2,132.0 | 2,191.4 | W | W | W | 2,042.9 |
| 1999 | W | W | W | 1,748.1 | W | 2,071.0 | W | W | 2,045.0 | W | W | W |
| 2000 | W | W | W | W | 1,910.1 | W | 1,577.6 | W | W | W | W | W |
| 2001 | W | W | 1,513.8 | W | W | W | 1,769.1 | W | 1,442.8 | W | W | 1,488.1 |
| 2002 | W | W | W | W | W | W | W | W | W | W | W | W |
| 2003 | W | 1,922.0 | 1,924.2 | W | 2,041.8 | 2,033.9 | 2,059.8 | 2,181.0 | 2,189.9 | 2,231.9 | 2,143.5 | W |
| 2004 | 2,206.3 | 2,101.9 | 2,213.7 | W | 2,261.4 | 2,460.0 | 2,362.1 | 2,294.1 | 2,314.8 | 2,345.6 | 2,315.8 | 2,411.5 |
| 2005 | 2,011.7 | 2,125.1 | W | 2,077.7 | 2,340.1 | 2,388.1 | 2,364.2 | 2,391.4 | 2,083.3 | 2,277.5 | 2,286.3 | 2,024.5 |
| 2006 | 2,000.4 | 1,968.6 | 1,907.0 | 1,864.5 | 2,341.4 | 2,505.8 | 2,185.3 | 2,268.8 | 2,168.8 | 2,091.0 | 1,962.2 | 2,041.0 |
| 2007 | 2,063.7 | 2,090.8 | 1,992.0 | 1,898.4 | 1,824.3 | 1,933.8 | 1,862.1 | 1,993.1 | 1,726.8 | 1,769.2 | 1,715.2 | 2,036.9 |
| 2008 | 2,105.0 | 2,289.0 | 2,123.9 | 2,136.5 | 1,950.1 | 1,873.5 | 1,906.6 | 2,089.3 | 1,959.0 | 2,223.9 | 2,139.8 | 2,138.3 |
| 2009 | 1,952.4 | 2,011.0 | 1,935.5 | 1,905.4 | 1,870.2 | 2,018.6 | 2,042.5 | 2,150.5 | 1,877.8 | 1,837.6 | 1,667.3 | 1,937.4 |
| 2010 | 1,733.6 | 1,740.7 | 1,841.6 | 1,892.3 | 1,902.9 | 2,085.5 | 2,101.4 | 2,107.3 | 2,092.2 | 2,083.1 | 2,128.7 | 2,145.2 |
| 2011 | 2,038.3 | 2,160.5 | 2,313.2 | W | W | W | W | W | W | W | W | W |
| 2012 | W | W | W | W | W | W | W | 2,248.5 | 2,168.1 | 1,954.7 | 1,984.8 | 1,715.4 |
| 2013 | 1,484.2 | 1,582.0 | 1,514.1 | 1,737.9 | 1,729.4 | 1,760.9 | 1,817.1 | 1,920.1 | 1,871.5 | 1,753.5 | 1,888.9 | 1,908.1 |
| 2014 | W | 2,065.8 | W | W | W | W | W | 1,390.9 | 1,292.9 | 1,521.5 | 1,351.3 | 1,211.5 |
| 2015 | 1,179.7 | 1,155.6 | 1,060.2 | 999.9 | 1,042.5 | 1,071.6 | 1,023.1 | 1,018.9 | 1,016.2 | 1,052.7 | 1,004.6 | 994.5 |
| 2016 | 1,023.1 | W | W | W | 1,015.0 | W | W | W | W | W | W | W |
| 2017 | W | W | W | W | W | W | W | W | W | 996.9 | 1,049.8 | 1,131.3 |
| 2018 | 1,139.7 | 1,114.6 | 1,163.4 | 1,151.3 | 1,242.7 | 1,312.2 | 1,321.9 | 1,388.0 | 1,379.1 | 1,423.9 | 1,500.3 | W |
| 2019 | 1,485.6 | 1,445.4 | 1,503.1 | 1,489.2 | 1,359.4 | 1,347.7 | 1,360.5 | 1,331.9 | 1,315.3 | 1,365.8 | 1,347.5 | 1,314.5 |
| 2020 | 1,136.0 | 1,223.6 | 967.6 | 692.2 | 937.4 | 1,157.1 | 1,192.2 | 1,235.4 | 1,217.6 | 1,243.3 | 1,103.6 | 1,169.4 |
| 2021 | 1,193.2 | 1,235.9 | 1,334.9 | 1,363.2 | 1,641.4 | 1,970.0 | 2,080.8 | 2,006.5 | 1,965.2 | 1,922.7 | 1,996.6 | 2,010.6 |
| 2022 | 1,905.1 | 2,112.2 | 1,819.0 | |||||||||
| - = No Data Reported; -- = Not Applicable; NA = Not Available; W = Withheld to avoid disclosure of individual company data. |
| Release Date: 6/1/2022 |
| Next Release Date: TBD |