|
Download Data (XLS File) |
|
||||||||
|
||||||||
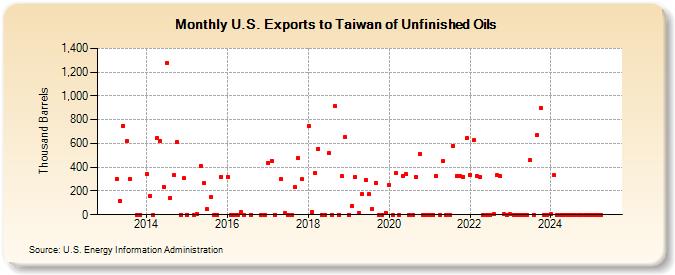
| U.S. Exports to Taiwan of Unfinished Oils (Thousand Barrels) | ||||||||
| Year | Jan | Feb | Mar | Apr | May | Jun | Jul | Aug | Sep | Oct | Nov | Dec |
|---|---|---|---|---|---|---|---|---|---|---|---|---|
| 2013 | 304 | 115 | 749 | 617 | 303 | 0 | 0 | |||||
| 2014 | 339 | 159 | 0 | 646 | 621 | 235 | 1,281 | 142 | 334 | 612 | 0 | 305 |
| 2015 | 0 | 1 | 8 | 411 | 263 | 48 | 145 | 0 | 0 | 321 | ||
| 2016 | 320 | 0 | 1 | 0 | 19 | 0 | 0 | 0 | 1 | |||
| 2017 | 436 | 455 | 0 | 297 | 13 | 0 | 0 | 230 | 476 | 297 | ||
| 2018 | 747 | 25 | 348 | 554 | 1 | 0 | 518 | 0 | 913 | 1 | 323 | 654 |
| 2019 | 1 | 72 | 319 | 13 | 174 | 294 | 172 | 52 | 267 | 0 | 0 | 17 |
| 2020 | 251 | 0 | 348 | 0 | 324 | 339 | 0 | 0 | 319 | 514 | 1 | 1 |
| 2021 | 0 | 0 | 326 | 0 | 451 | 0 | 0 | 581 | 327 | 322 | 320 | 645 |
| 2022 | 335 | 625 | 326 | 320 | 1 | 0 | 0 | 2 | 331 | 325 | 3 | 1 |
| 2023 | 2 | 0 | 1 | 1 | 1 | 1 | 458 | 1 | 445 | 1,125 | 1 | 1 |
| 2024 | 2 | 331 | ||||||||||
| - = No Data Reported; -- = Not Applicable; NA = Not Available; W = Withheld to avoid disclosure of individual company data. |
| Release Date: 4/30/2024 |
| Next Release Date: 5/31/2024 |