|
Download Data (XLS File) |
|
||||||||
|
||||||||
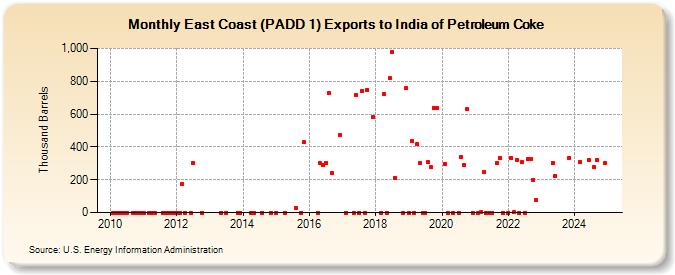
| East Coast (PADD 1) Exports to India of Petroleum Coke (Thousand Barrels) | ||||||||
| Year | Jan | Feb | Mar | Apr | May | Jun | Jul | Aug | Sep | Oct | Nov | Dec |
|---|---|---|---|---|---|---|---|---|---|---|---|---|
| 2010 | 0 | 0 | 0 | 0 | 0 | 0 | 0 | 0 | 0 | 0 | ||
| 2011 | 0 | 0 | 0 | 0 | 0 | 0 | 0 | 0 | 0 | |||
| 2012 | 0 | 0 | 173 | 0 | 0 | 300 | 0 | |||||
| 2013 | 0 | 0 | 0 | 0 | ||||||||
| 2014 | 0 | 0 | 0 | 0 | ||||||||
| 2015 | 0 | 0 | 28 | 0 | 427 | |||||||
| 2016 | 0 | 300 | 287 | 302 | 726 | 242 | 472 | |||||
| 2017 | 0 | 0 | 715 | 0 | 743 | 0 | 748 | 581 | ||||
| 2018 | 0 | 723 | 0 | 818 | 979 | 213 | 0 | 759 | ||||
| 2019 | 0 | 433 | 0 | 416 | 299 | 0 | 0 | 305 | 275 | 638 | 634 | |
| 2020 | 298 | 0 | 0 | 0 | 337 | 292 | 628 | 0 | ||||
| 2021 | 0 | 1 | 245 | 0 | 0 | 0 | 303 | 333 | 0 | |||
| 2022 | 0 | 332 | 1 | 323 | 0 | 309 | 0 | 324 | 325 | 201 | 77 | |
| 2023 | 302 | 225 | 334 | |||||||||
| 2024 | 309 | 321 | 275 | 318 | 303 | |||||||
| - = No Data Reported; -- = Not Applicable; NA = Not Available; W = Withheld to avoid disclosure of individual company data. |
| Release Date: 6/30/2025 |
| Next Release Date: 7/31/2025 |