|
Download Data (XLS File) |
|
||||||||
|
||||||||
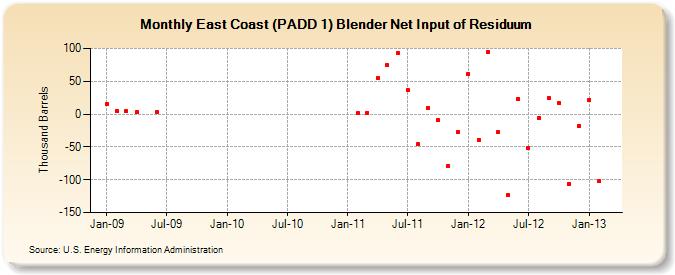
| East Coast (PADD 1) Blender Net Input of Residuum (Thousand Barrels) | ||||||||
| Year | Jan | Feb | Mar | Apr | May | Jun | Jul | Aug | Sep | Oct | Nov | Dec |
|---|---|---|---|---|---|---|---|---|---|---|---|---|
| 2009 | 15 | 5 | 4 | 3 | 3 | |||||||
| 2011 | 1 | 2 | 55 | 74 | 93 | 37 | -46 | 9 | -9 | -79 | -27 | |
| 2012 | 61 | -39 | 95 | -28 | -123 | 23 | -52 | -6 | 24 | 17 | -106 | -18 |
| 2013 | 22 | -102 | ||||||||||
| - = No Data Reported; -- = Not Applicable; NA = Not Available; W = Withheld to avoid disclosure of individual company data. |
| Release Date: 3/29/2024 |
| Next Release Date: 4/30/2024 |