|
Download Data (XLS File) |
|
||||||||
|
||||||||
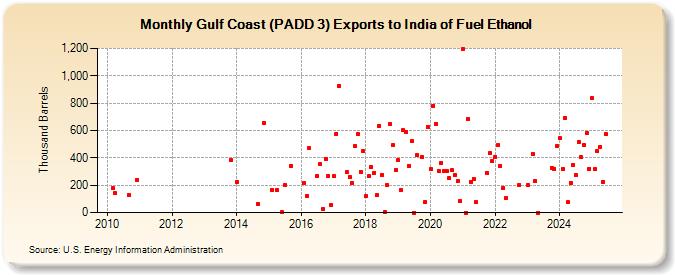
| Gulf Coast (PADD 3) Exports to India of Fuel Ethanol (Thousand Barrels) | ||||||||
| Year | Jan | Feb | Mar | Apr | May | Jun | Jul | Aug | Sep | Oct | Nov | Dec |
|---|---|---|---|---|---|---|---|---|---|---|---|---|
| 2010 | 177 | 141 | 127 | 239 | ||||||||
| 2013 | 386 | |||||||||||
| 2014 | 223 | 66 | 657 | |||||||||
| 2015 | 167 | 166 | 2 | 202 | 341 | |||||||
| 2016 | 214 | 123 | 470 | 267 | 352 | 24 | 393 | 266 | 56 | |||
| 2017 | 264 | 577 | 926 | 294 | 261 | 214 | 483 | 572 | 300 | 447 | ||
| 2018 | 120 | 265 | 333 | 292 | 126 | 636 | 276 | 6 | 198 | 646 | 493 | 314 |
| 2019 | 383 | 165 | 602 | 590 | 343 | 521 | 0 | 420 | 405 | 79 | 628 | |
| 2020 | 317 | 781 | 649 | 307 | 365 | 305 | 307 | 249 | 308 | 277 | 229 | 86 |
| 2021 | 1,196 | 0 | 684 | 227 | 244 | 75 | 290 | 433 | 380 | |||
| 2022 | 407 | 493 | 343 | 180 | 107 | 202 | ||||||
| 2023 | 202 | 542 | 314 | 14 | 326 | 322 | 488 | |||||
| 2024 | 786 | 318 | 511 | 436 | ||||||||
| - = No Data Reported; -- = Not Applicable; NA = Not Available; W = Withheld to avoid disclosure of individual company data. |
| Release Date: 6/28/2024 |
| Next Release Date: 7/31/2024 |