|
Download Data (XLS File) |
|
||||||||
|
||||||||
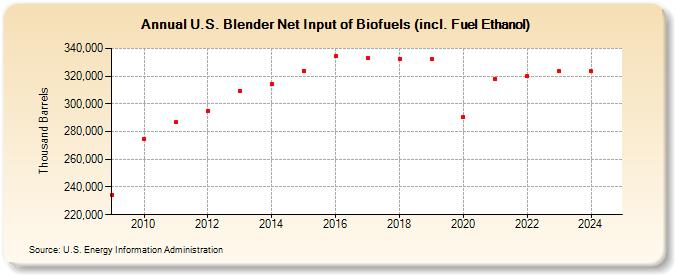
| U.S. Blender Net Input of Biofuels (incl. Fuel Ethanol) (Thousand Barrels) | ||||||||
| Decade | Year-0 | Year-1 | Year-2 | Year-3 | Year-4 | Year-5 | Year-6 | Year-7 | Year-8 | Year-9 |
|---|---|---|---|---|---|---|---|---|---|---|
| 2000's | 234,047 | |||||||||
| 2010's | 274,974 | 286,837 | 295,004 | 309,471 | 314,161 | 323,915 | 334,313 | 333,316 | 332,559 | 332,333 |
| 2020's | 290,315 | 318,070 | 319,859 | 323,478 |
| - = No Data Reported; -- = Not Applicable; NA = Not Available; W = Withheld to avoid disclosure of individual company data. |
| Release Date: 6/28/2024 |
| Next Release Date: 8/30/2024 |
Referring Pages: