|
Download Data (XLS File) |
|
||||||||
|
||||||||
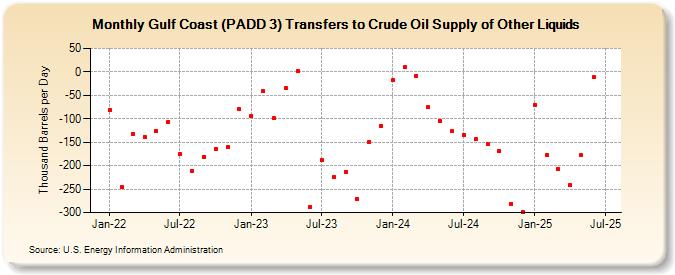
| Gulf Coast (PADD 3) Transfers to Crude Oil Supply of Other Liquids (Thousand Barrels per Day) | ||||||||
| Year | Jan | Feb | Mar | Apr | May | Jun | Jul | Aug | Sep | Oct | Nov | Dec |
|---|---|---|---|---|---|---|---|---|---|---|---|---|
| 2022 | -81 | -245 | -133 | -138 | -126 | -106 | -175 | -211 | -181 | -165 | -160 | -80 |
| 2023 | -99 | -19 | -81 | -27 | 8 | -264 | -188 | -241 | -198 | -249 | -138 | -116 |
| 2024 | -11 | -10 | -6 | -95 | ||||||||
| - = No Data Reported; -- = Not Applicable; NA = Not Available; W = Withheld to avoid disclosure of individual company data. |
| Release Date: 6/28/2024 |
| Next Release Date: 7/31/2024 |