|
Download Data (XLS File) |
|
||||||||
|
||||||||
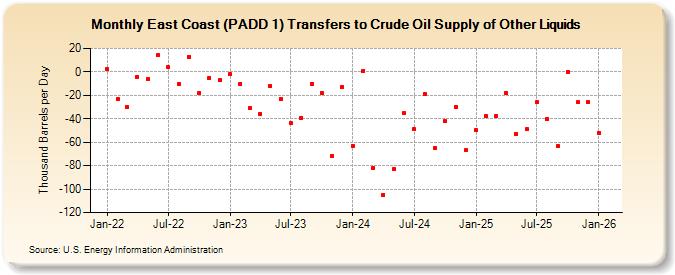
| East Coast (PADD 1) Transfers to Crude Oil Supply of Other Liquids (Thousand Barrels per Day) | ||||||||
| Year | Jan | Feb | Mar | Apr | May | Jun | Jul | Aug | Sep | Oct | Nov | Dec |
|---|---|---|---|---|---|---|---|---|---|---|---|---|
| 2022 | 2 | -23 | -30 | -4 | -6 | 14 | 4 | -10 | 13 | -18 | -5 | -7 |
| 2023 | -9 | -7 | -31 | -38 | -8 | -25 | -43 | -40 | -8 | -25 | -66 | -16 |
| 2024 | -66 | -21 | ||||||||||
| - = No Data Reported; -- = Not Applicable; NA = Not Available; W = Withheld to avoid disclosure of individual company data. |
| Release Date: 4/30/2024 |
| Next Release Date: 5/31/2024 |