|
Download Data (XLS File) |
|
||||||||
|
||||||||
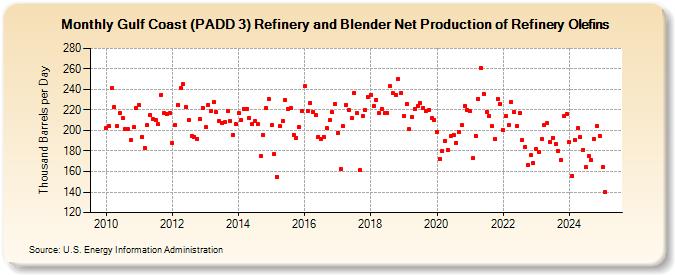
| Gulf Coast (PADD 3) Refinery and Blender Net Production of Refinery Olefins (Thousand Barrels per Day) | ||||||||
| Year | Jan | Feb | Mar | Apr | May | Jun | Jul | Aug | Sep | Oct | Nov | Dec |
|---|---|---|---|---|---|---|---|---|---|---|---|---|
| 2010 | 202 | 204 | 241 | 223 | 204 | 217 | 212 | 201 | 201 | 191 | 203 | 222 |
| 2011 | 225 | 194 | 183 | 205 | 215 | 211 | 210 | 206 | 235 | 217 | 216 | 217 |
| 2012 | 188 | 205 | 225 | 241 | 245 | 223 | 210 | 195 | 194 | 192 | 211 | 222 |
| 2013 | 203 | 225 | 219 | 228 | 218 | 209 | 207 | 208 | 219 | 209 | 196 | 206 |
| 2014 | 217 | 210 | 221 | 221 | 212 | 206 | 209 | 206 | 175 | 196 | 222 | 231 |
| 2015 | 205 | 177 | 155 | 204 | 209 | 230 | 221 | 222 | 196 | 193 | 203 | 219 |
| 2016 | 243 | 219 | 227 | 218 | 215 | 194 | 192 | 194 | 202 | 210 | 218 | 226 |
| 2017 | 198 | 162 | 204 | 225 | 220 | 212 | 237 | 217 | 161 | 214 | 220 | 233 |
| 2018 | 235 | 224 | 230 | 217 | 221 | 217 | 217 | 243 | 237 | 235 | 250 | 237 |
| 2019 | 214 | 226 | 201 | 213 | 221 | 224 | 227 | 222 | 219 | 220 | 212 | 210 |
| 2020 | 199 | 172 | 180 | 190 | 181 | 195 | 196 | 188 | 199 | 205 | 224 | 220 |
| 2021 | 219 | 173 | 195 | 231 | 261 | 236 | 218 | 214 | 204 | 192 | 231 | 226 |
| 2022 | 200 | 214 | 205 | 228 | 218 | 204 | 217 | 191 | 184 | 166 | 176 | 168 |
| 2023 | 182 | 179 | 192 | 205 | 207 | 189 | 193 | 187 | 180 | 171 | 214 | 216 |
| 2024 | 189 | 156 | 191 | 202 | 194 | 181 | ||||||
| - = No Data Reported; -- = Not Applicable; NA = Not Available; W = Withheld to avoid disclosure of individual company data. |
| Release Date: 8/30/2024 |
| Next Release Date: 9/30/2024 |