|
Download Data (XLS File) |
|
||||||||
|
||||||||
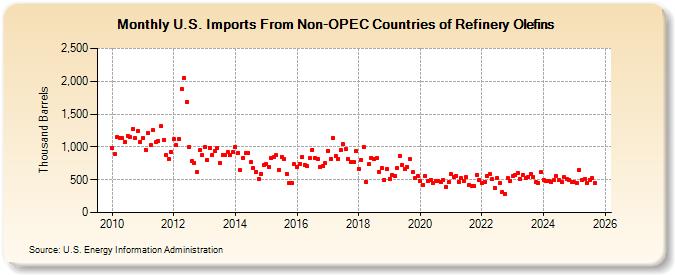
| U.S. Imports From Non-OPEC Countries of Refinery Olefins (Thousand Barrels) | ||||||||
| Year | Jan | Feb | Mar | Apr | May | Jun | Jul | Aug | Sep | Oct | Nov | Dec |
|---|---|---|---|---|---|---|---|---|---|---|---|---|
| 2010 | 978 | 894 | 1,149 | 1,141 | 1,129 | 1,082 | 1,172 | 1,150 | 1,276 | 1,131 | 1,242 | 1,080 |
| 2011 | 1,139 | 960 | 1,219 | 1,022 | 1,251 | 1,069 | 1,087 | 1,314 | 1,108 | 869 | 813 | 920 |
| 2012 | 1,122 | 1,025 | 1,114 | 1,886 | 2,052 | 1,682 | 1,005 | 780 | 758 | 611 | 948 | 881 |
| 2013 | 1,001 | 798 | 984 | 880 | 933 | 981 | 760 | 880 | 876 | 920 | 878 | 916 |
| 2014 | 1,005 | 912 | 648 | 836 | 904 | 911 | 765 | 676 | 620 | 517 | 592 | 717 |
| 2015 | 738 | 699 | 827 | 839 | 872 | 654 | 852 | 809 | 592 | 452 | 455 | 735 |
| 2016 | 687 | 744 | 848 | 731 | 702 | 827 | 959 | 831 | 822 | 696 | 715 | 749 |
| 2017 | 945 | 816 | 1,137 | 867 | 814 | 956 | 1,040 | 971 | 816 | 777 | 763 | 940 |
| 2018 | 663 | 801 | 995 | 467 | 732 | 837 | 810 | 830 | 625 | 671 | 501 | 658 |
| 2019 | 517 | 573 | 560 | 674 | 866 | 723 | 665 | 700 | 809 | 614 | 527 | 555 |
| 2020 | 480 | 422 | 555 | 482 | 500 | 453 | 480 | 474 | 458 | 502 | 392 | 458 |
| 2021 | 581 | 537 | 557 | 471 | 521 | 488 | 535 | 419 | 410 | 403 | 575 | 500 |
| 2022 | 455 | 469 | 564 | 583 | 507 | 381 | 530 | 450 | 315 | 286 | 522 | 486 |
| 2023 | 529 | 575 | 600 | 516 | 577 | 530 | 539 | 587 | 535 | 467 | 454 | 620 |
| 2024 | 388 | |||||||||||
| - = No Data Reported; -- = Not Applicable; NA = Not Available; W = Withheld to avoid disclosure of individual company data. |
| Release Date: 3/29/2024 |
| Next Release Date: 4/30/2024 |