|
Download Data (XLS File) |
|
||||||||
|
||||||||
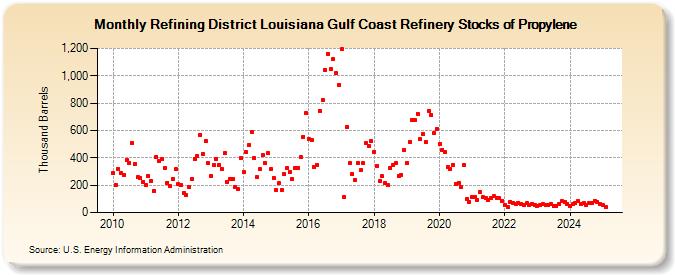
| Refining District Louisiana Gulf Coast Refinery Stocks of Propylene (Thousand Barrels) | ||||||||
| Year | Jan | Feb | Mar | Apr | May | Jun | Jul | Aug | Sep | Oct | Nov | Dec |
|---|---|---|---|---|---|---|---|---|---|---|---|---|
| 2010 | 286 | 202 | 319 | 292 | 278 | 382 | 364 | 510 | 355 | 257 | 252 | 225 |
| 2011 | 202 | 266 | 229 | 160 | 407 | 376 | 391 | 328 | 218 | 192 | 246 | 315 |
| 2012 | 206 | 201 | 144 | 125 | 190 | 244 | 392 | 412 | 570 | 429 | 520 | 361 |
| 2013 | 267 | 349 | 395 | 350 | 322 | 434 | 226 | 248 | 248 | 189 | 170 | 397 |
| 2014 | 294 | 442 | 494 | 592 | 399 | 258 | 318 | 419 | 361 | 432 | 315 | 255 |
| 2015 | 166 | 214 | 165 | 279 | 324 | 293 | 246 | 329 | 329 | 403 | 555 | 725 |
| 2016 | 536 | 527 | 332 | 350 | 745 | 825 | 1,045 | 1,162 | 1,047 | 1,121 | 1,017 | 936 |
| 2017 | 1,192 | 112 | 627 | 362 | 280 | 238 | 363 | 309 | 362 | 508 | 487 | 520 |
| 2018 | 446 | 342 | 230 | 265 | 216 | 199 | 329 | 344 | 363 | 268 | 277 | 457 |
| 2019 | 361 | 518 | 679 | 676 | 723 | 535 | 577 | 515 | 741 | 712 | 583 | 611 |
| 2020 | 500 | 460 | 440 | 333 | 318 | 349 | 207 | 218 | 186 | 348 | 100 | 78 |
| 2021 | 112 | 116 | 90 | 147 | 111 | 106 | 92 | 106 | 120 | 106 | 103 | 88 |
| 2022 | 52 | 39 | 80 | 72 | 64 | 72 | 64 | 55 | 67 | 57 | 64 | 56 |
| 2023 | 49 | 55 | 59 | 56 | 55 | 63 | 45 | 49 | 62 | 81 | 80 | 65 |
| 2024 | 49 | 61 | 70 | 83 | 61 | 68 | 54 | 69 | 67 | 85 | 80 | 64 |
| 2025 | 56 | 43 | 56 | 71 | ||||||||
| - = No Data Reported; -- = Not Applicable; NA = Not Available; W = Withheld to avoid disclosure of individual company data. |
| Release Date: 6/30/2025 |
| Next Release Date: 7/31/2025 |
Referring Pages: