|
Download Data (XLS File) |
|
||||||||
|
||||||||
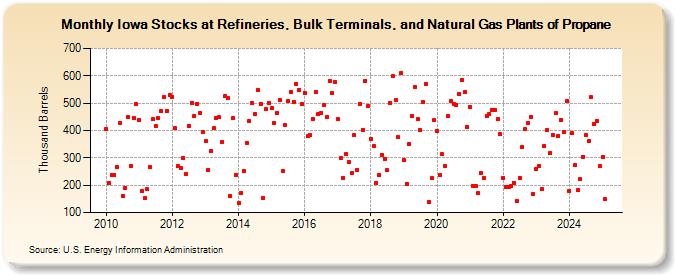
| Iowa Stocks at Refineries, Bulk Terminals, and Natural Gas Plants of Propane (Thousand Barrels) | ||||||||
| Year | Jan | Feb | Mar | Apr | May | Jun | Jul | Aug | Sep | Oct | Nov | Dec |
|---|---|---|---|---|---|---|---|---|---|---|---|---|
| 2010 | 407 | 207 | 238 | 237 | 266 | 429 | 160 | 190 | 448 | 269 | 444 | 495 |
| 2011 | 438 | 178 | 152 | 185 | 265 | 441 | 417 | 444 | 472 | 523 | 472 | 530 |
| 2012 | 524 | 408 | 269 | 263 | 301 | 241 | 418 | 502 | 454 | 498 | 463 | 394 |
| 2013 | 360 | 257 | 325 | 408 | 446 | 448 | 359 | 525 | 517 | 160 | 444 | 238 |
| 2014 | 134 | 170 | 252 | 356 | 435 | 500 | 461 | 548 | 496 | 155 | 478 | 502 |
| 2015 | 481 | 428 | 465 | 513 | 253 | 419 | 506 | 541 | 505 | 570 | 549 | 498 |
| 2016 | 538 | 379 | 384 | 443 | 541 | 460 | 465 | 493 | 450 | 582 | 537 | 577 |
| 2017 | 441 | 298 | 228 | 314 | 283 | 246 | 382 | 257 | 497 | 402 | 582 | 490 |
| 2018 | 368 | 344 | 208 | 237 | 312 | 297 | 254 | 500 | 599 | 510 | 375 | 611 |
| 2019 | 292 | 206 | 351 | 452 | 560 | 441 | 401 | 504 | 571 | 139 | 225 | 437 |
| 2020 | 399 | 236 | 313 | 269 | 452 | 509 | 498 | 494 | 533 | 585 | 539 | 413 |
| 2021 | 487 | 198 | 198 | 170 | 244 | 226 | 452 | 459 | 476 | 474 | 441 | 386 |
| 2022 | 227 | 195 | 194 | 196 | 209 | 142 | 228 | 339 | 405 | 428 | 450 | 169 |
| 2023 | 261 | 271 | 186 | 344 | 400 | 317 | 384 | 464 | 379 | 440 | 395 | 507 |
| 2024 | 180 | |||||||||||
| - = No Data Reported; -- = Not Applicable; NA = Not Available; W = Withheld to avoid disclosure of individual company data. |
| Release Date: 3/29/2024 |
| Next Release Date: 4/30/2024 |