|
Download Data (XLS File) |
|
||||||||
|
||||||||
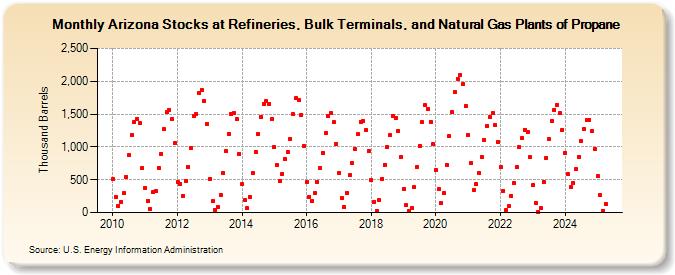
| Arizona Stocks at Refineries, Bulk Terminals, and Natural Gas Plants of Propane (Thousand Barrels) | ||||||||
| Year | Jan | Feb | Mar | Apr | May | Jun | Jul | Aug | Sep | Oct | Nov | Dec |
|---|---|---|---|---|---|---|---|---|---|---|---|---|
| 2010 | 510 | 242 | 103 | 163 | 299 | 546 | 870 | 1,178 | 1,376 | 1,426 | 1,365 | 681 |
| 2011 | 379 | 180 | 51 | 320 | 325 | 683 | 897 | 1,268 | 1,524 | 1,560 | 1,427 | 1,053 |
| 2012 | 466 | 441 | 258 | 488 | 701 | 985 | 1,474 | 1,504 | 1,817 | 1,873 | 1,702 | 1,351 |
| 2013 | 517 | 176 | 42 | 88 | 273 | 602 | 936 | 1,195 | 1,499 | 1,514 | 1,422 | 897 |
| 2014 | 431 | 192 | 64 | 238 | 601 | 926 | 1,201 | 1,457 | 1,658 | 1,700 | 1,659 | 1,423 |
| 2015 | 1,003 | 726 | 476 | 592 | 816 | 924 | 1,124 | 1,497 | 1,741 | 1,721 | 1,483 | 1,012 |
| 2016 | 467 | 242 | 176 | 296 | 472 | 677 | 912 | 1,211 | 1,464 | 1,512 | 1,372 | 1,045 |
| 2017 | 606 | 224 | 82 | 304 | 570 | 750 | 967 | 1,191 | 1,383 | 1,394 | 1,260 | 940 |
| 2018 | 489 | 166 | 25 | 190 | 516 | 730 | 1,005 | 1,177 | 1,465 | 1,440 | 1,243 | 840 |
| 2019 | 363 | 111 | 27 | 66 | 388 | 698 | 1,019 | 1,374 | 1,634 | 1,578 | 1,382 | 1,037 |
| 2020 | 651 | 358 | 145 | 302 | 725 | 1,164 | 1,526 | 1,835 | 2,037 | 2,094 | 1,954 | 1,624 |
| 2021 | 1,179 | 748 | 347 | 430 | 602 | 845 | 1,103 | 1,321 | 1,457 | 1,509 | 1,337 | 1,078 |
| 2022 | 687 | 330 | 33 | 94 | 251 | 456 | 688 | 998 | 1,141 | 1,263 | 1,230 | 840 |
| 2023 | 414 | 148 | 11 | 63 | 470 | 837 | 1,127 | 1,401 | 1,567 | 1,642 | 1,509 | 1,262 |
| 2024 | 907 | 583 | 388 | 457 | 669 | 851 | ||||||
| - = No Data Reported; -- = Not Applicable; NA = Not Available; W = Withheld to avoid disclosure of individual company data. |
| Release Date: 8/30/2024 |
| Next Release Date: 9/30/2024 |