|
Download Data (XLS File) |
|
||||||||
|
||||||||
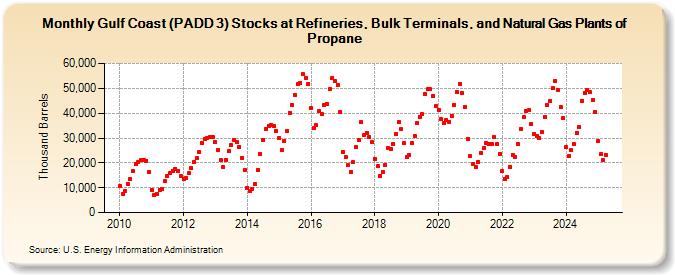
| Gulf Coast (PADD 3) Stocks at Refineries, Bulk Terminals, and Natural Gas Plants of Propane (Thousand Barrels) | ||||||||
| Year | Jan | Feb | Mar | Apr | May | Jun | Jul | Aug | Sep | Oct | Nov | Dec |
|---|---|---|---|---|---|---|---|---|---|---|---|---|
| 2010 | 10,500 | 7,394 | 8,585 | 11,601 | 13,584 | 16,627 | 19,528 | 20,421 | 20,971 | 21,060 | 20,918 | 16,291 |
| 2011 | 9,218 | 6,938 | 7,503 | 9,215 | 9,594 | 12,571 | 14,899 | 16,002 | 16,839 | 17,665 | 16,787 | 14,580 |
| 2012 | 13,308 | 13,931 | 15,787 | 17,803 | 20,250 | 21,793 | 24,448 | 27,996 | 29,651 | 30,209 | 30,472 | 30,370 |
| 2013 | 28,347 | 25,266 | 21,126 | 18,323 | 21,190 | 24,722 | 27,145 | 29,316 | 28,313 | 26,481 | 22,071 | 17,077 |
| 2014 | 9,939 | 8,572 | 9,591 | 11,421 | 17,305 | 23,594 | 29,261 | 33,657 | 34,925 | 35,313 | 34,706 | 32,906 |
| 2015 | 30,045 | 25,154 | 28,995 | 32,913 | 40,208 | 43,353 | 47,515 | 51,557 | 52,110 | 55,627 | 54,275 | 51,726 |
| 2016 | 42,085 | 33,896 | 35,105 | 40,726 | 39,649 | 43,434 | 43,762 | 49,695 | 54,298 | 52,923 | 51,506 | 40,375 |
| 2017 | 24,475 | 22,172 | 19,145 | 16,268 | 20,195 | 26,372 | 29,082 | 36,256 | 31,342 | 31,876 | 30,364 | 28,284 |
| 2018 | 21,727 | 18,581 | 14,736 | 16,149 | 19,223 | 26,000 | 25,695 | 27,615 | 31,593 | 36,408 | 33,469 | 27,835 |
| 2019 | 22,173 | 23,176 | 28,003 | 30,895 | 35,912 | 38,521 | 39,471 | 47,597 | 49,547 | 49,615 | 46,935 | 42,820 |
| 2020 | 41,283 | 37,604 | 36,137 | 37,171 | 36,525 | 39,043 | 43,487 | 48,614 | 51,630 | 47,941 | 42,554 | 29,727 |
| 2021 | 22,642 | 19,614 | 18,431 | 20,470 | 24,092 | 26,039 | 27,901 | 27,653 | 27,793 | 30,441 | 27,470 | 23,638 |
| 2022 | 16,587 | 13,442 | 14,256 | 18,386 | 23,041 | 22,518 | 27,741 | 33,741 | 38,352 | 41,043 | 41,164 | 35,840 |
| 2023 | 31,812 | 30,849 | 29,913 | 32,545 | 38,298 | 43,271 | 44,915 | 50,038 | 53,129 | 49,490 | 42,431 | 37,867 |
| 2024 | 26,331 | |||||||||||
| - = No Data Reported; -- = Not Applicable; NA = Not Available; W = Withheld to avoid disclosure of individual company data. |
| Release Date: 3/29/2024 |
| Next Release Date: 4/30/2024 |