|
Download Data (XLS File) |
|
||||||||
|
||||||||
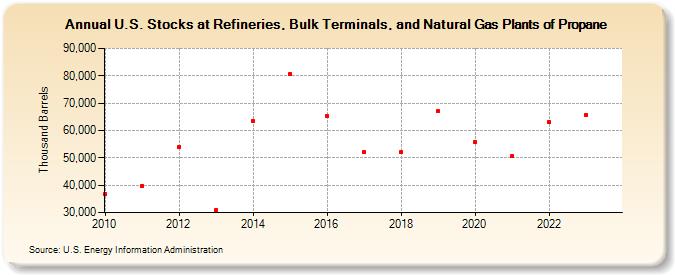
| U.S. Stocks at Refineries, Bulk Terminals, and Natural Gas Plants of Propane (Thousand Barrels) | ||||||||
| Decade | Year-0 | Year-1 | Year-2 | Year-3 | Year-4 | Year-5 | Year-6 | Year-7 | Year-8 | Year-9 |
|---|---|---|---|---|---|---|---|---|---|---|
| 2010's | 36,845 | 39,812 | 53,979 | 30,953 | 63,351 | 80,704 | 65,194 | 52,052 | 51,973 | 66,939 |
| 2020's | 55,622 | 50,500 | 63,073 | 65,797 |
| - = No Data Reported; -- = Not Applicable; NA = Not Available; W = Withheld to avoid disclosure of individual company data. |
| Release Date: 8/30/2024 |
| Next Release Date: 8/29/2025 |