|
Download Data (XLS File) |
|
||||||||
|
||||||||
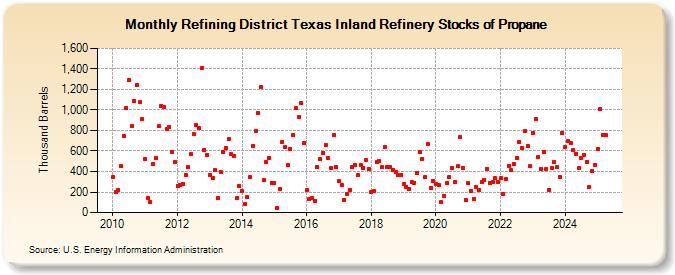
| Refining District Texas Inland Refinery Stocks of Propane (Thousand Barrels) | ||||||||
| Year | Jan | Feb | Mar | Apr | May | Jun | Jul | Aug | Sep | Oct | Nov | Dec |
|---|---|---|---|---|---|---|---|---|---|---|---|---|
| 2010 | 345 | 200 | 220 | 449 | 751 | 1,020 | 1,290 | 847 | 1,085 | 1,246 | 1,074 | 912 |
| 2011 | 522 | 142 | 104 | 478 | 532 | 839 | 1,043 | 1,032 | 814 | 837 | 594 | 489 |
| 2012 | 260 | 270 | 276 | 364 | 445 | 568 | 765 | 853 | 824 | 1,411 | 613 | 558 |
| 2013 | 367 | 337 | 410 | 139 | 399 | 592 | 631 | 713 | 567 | 553 | 141 | 261 |
| 2014 | 206 | 84 | 147 | 343 | 649 | 796 | 973 | 1,224 | 313 | 492 | 535 | 290 |
| 2015 | 290 | 46 | 233 | 692 | 637 | 462 | 622 | 756 | 1,017 | 932 | 1,071 | 678 |
| 2016 | 217 | 136 | 140 | 114 | 443 | 519 | 581 | 659 | 529 | 430 | 760 | 441 |
| 2017 | 303 | 264 | 123 | 183 | 222 | 445 | 462 | 363 | 463 | 432 | 513 | 425 |
| 2018 | 204 | 210 | 492 | 500 | 440 | 638 | 442 | 445 | 415 | 398 | 368 | 366 |
| 2019 | 280 | 252 | 231 | 295 | 288 | 388 | 591 | 521 | 343 | 666 | 243 | 311 |
| 2020 | 276 | 270 | 100 | 165 | 286 | 348 | 439 | 297 | 450 | 736 | 439 | 127 |
| 2021 | 285 | 208 | 130 | 245 | 221 | 299 | 318 | 429 | 291 | 299 | 332 | 293 |
| 2022 | 334 | 182 | 326 | 456 | 411 | 471 | 531 | 691 | 632 | 793 | 653 | 450 |
| 2023 | 776 | 912 | 546 | 423 | 592 | 422 | 220 | 433 | 497 | 440 | 346 | 779 |
| 2024 | 635 | 694 | 678 | 605 | ||||||||
| - = No Data Reported; -- = Not Applicable; NA = Not Available; W = Withheld to avoid disclosure of individual company data. |
| Release Date: 6/28/2024 |
| Next Release Date: 7/31/2024 |
Referring Pages: