|
Download Data (XLS File) |
|
||||||||
|
||||||||
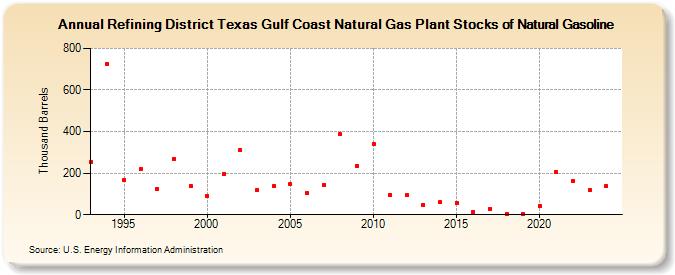
| Refining District Texas Gulf Coast Natural Gas Plant Stocks of Natural Gasoline (Thousand Barrels) | ||||||||
| Decade | Year-0 | Year-1 | Year-2 | Year-3 | Year-4 | Year-5 | Year-6 | Year-7 | Year-8 | Year-9 |
|---|---|---|---|---|---|---|---|---|---|---|
| 1990's | 254 | 726 | 165 | 220 | 126 | 269 | 137 | |||
| 2000's | 89 | 198 | 311 | 118 | 138 | 146 | 105 | 145 | 387 | 234 |
| 2010's | 341 | 95 | 94 | 47 | 60 | 58 | 14 | 29 | 3 | 4 |
| 2020's | 44 | 204 | 162 | 118 |
| - = No Data Reported; -- = Not Applicable; NA = Not Available; W = Withheld to avoid disclosure of individual company data. |
| Release Date: 6/28/2024 |
| Next Release Date: 8/30/2024 |