|
Download Data (XLS File) |
|
||||||||
|
||||||||
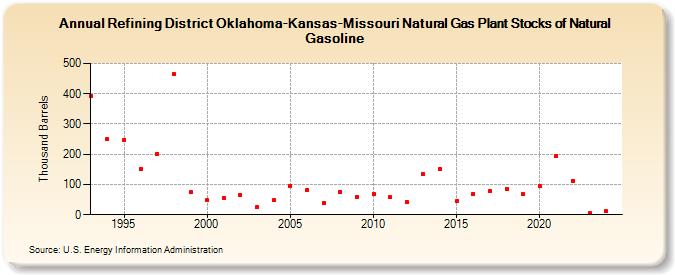
| Refining District Oklahoma-Kansas-Missouri Natural Gas Plant Stocks of Natural Gasoline (Thousand Barrels) | ||||||||
| Decade | Year-0 | Year-1 | Year-2 | Year-3 | Year-4 | Year-5 | Year-6 | Year-7 | Year-8 | Year-9 |
|---|---|---|---|---|---|---|---|---|---|---|
| 1990's | 393 | 250 | 246 | 152 | 202 | 465 | 74 | |||
| 2000's | 47 | 56 | 65 | 24 | 48 | 96 | 81 | 39 | 76 | 59 |
| 2010's | 68 | 57 | 42 | 134 | 150 | 45 | 68 | 78 | 86 | 67 |
| 2020's | 95 | 194 | 113 | 3 |
| - = No Data Reported; -- = Not Applicable; NA = Not Available; W = Withheld to avoid disclosure of individual company data. |
| Release Date: 4/30/2024 |
| Next Release Date: 8/30/2024 |