|
Download Data (XLS File) |
|
||||||||
|
||||||||
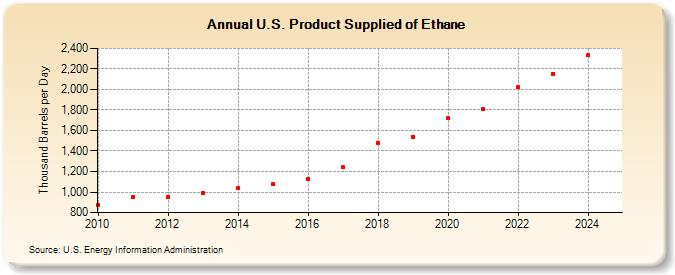
| U.S. Product Supplied of Ethane (Thousand Barrels per Day) | ||||||||
| Decade | Year-0 | Year-1 | Year-2 | Year-3 | Year-4 | Year-5 | Year-6 | Year-7 | Year-8 | Year-9 |
|---|---|---|---|---|---|---|---|---|---|---|
| 2010's | 874 | 948 | 950 | 995 | 1,041 | 1,074 | 1,130 | 1,240 | 1,479 | 1,537 |
| 2020's | 1,718 | 1,807 | 2,019 | 2,154 | 2,331 |
| - = No Data Reported; -- = Not Applicable; NA = Not Available; W = Withheld to avoid disclosure of individual company data. |
| Release Date: 6/30/2025 |
| Next Release Date: 8/29/2025 |