|
Download Data (XLS File) |
|
||||||||
|
||||||||
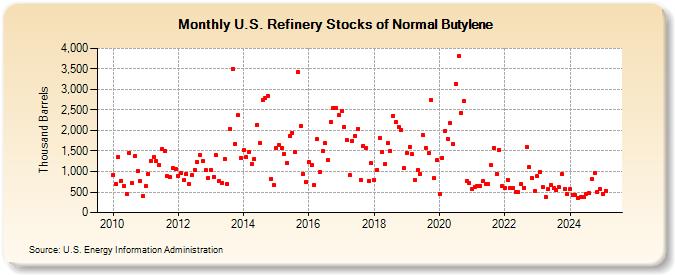
| U.S. Refinery Stocks of Normal Butylene (Thousand Barrels) | ||||||||
| Year | Jan | Feb | Mar | Apr | May | Jun | Jul | Aug | Sep | Oct | Nov | Dec |
|---|---|---|---|---|---|---|---|---|---|---|---|---|
| 2010 | 916 | 689 | 1,357 | 774 | 655 | 462 | 1,458 | 719 | 1,374 | 1,014 | 768 | 401 |
| 2011 | 649 | 951 | 1,267 | 1,351 | 1,251 | 1,154 | 1,544 | 1,512 | 889 | 855 | 1,097 | 1,055 |
| 2012 | 891 | 971 | 796 | 951 | 696 | 917 | 1,034 | 1,229 | 1,409 | 1,255 | 1,026 | 848 |
| 2013 | 1,037 | 875 | 1,392 | 757 | 724 | 1,303 | 699 | 2,043 | 3,506 | 1,682 | 2,370 | 1,331 |
| 2014 | 1,513 | 1,353 | 1,473 | 1,189 | 1,306 | 2,135 | 1,696 | 2,740 | 2,799 | 2,842 | 828 | 677 |
| 2015 | 1,582 | 1,643 | 1,578 | 1,435 | 1,200 | 1,861 | 1,950 | 1,474 | 3,419 | 2,097 | 945 | 744 |
| 2016 | 1,234 | 1,151 | 665 | 1,791 | 978 | 1,505 | 1,685 | 1,278 | 2,212 | 2,554 | 2,558 | 2,369 |
| 2017 | 2,469 | 2,080 | 1,772 | 905 | 1,746 | 1,873 | 2,048 | 804 | 1,627 | 1,571 | 779 | 1,204 |
| 2018 | 804 | 1,043 | 1,819 | 1,470 | 1,176 | 1,693 | 1,500 | 2,364 | 2,216 | 2,091 | 2,013 | 1,075 |
| 2019 | 1,460 | 1,598 | 1,415 | 796 | 1,036 | 935 | 1,882 | 1,573 | 1,454 | 2,749 | 834 | 1,273 |
| 2020 | 458 | 1,337 | 1,982 | 1,799 | 2,188 | 1,670 | 3,133 | 3,821 | 2,437 | 2,724 | 770 | 720 |
| 2021 | 567 | 633 | 635 | 656 | 767 | 695 | 686 | 1,147 | 1,585 | 951 | 1,533 | 641 |
| 2022 | 593 | 801 | 592 | 608 | 490 | 497 | 701 | 605 | 1,599 | 1,100 | 837 | 519 |
| 2023 | 885 | 983 | 615 | 385 | 563 | 673 | 592 | 547 | 613 | 936 | 575 | 449 |
| 2024 | 565 | 434 | 418 | 343 | ||||||||
| - = No Data Reported; -- = Not Applicable; NA = Not Available; W = Withheld to avoid disclosure of individual company data. |
| Release Date: 6/28/2024 |
| Next Release Date: 7/31/2024 |