|
Download Data (XLS File) |
|
||||||||
|
||||||||
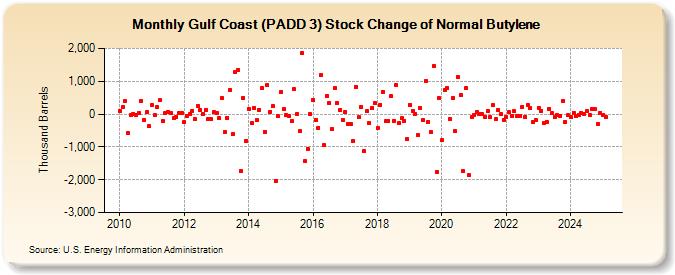
| Gulf Coast (PADD 3) Stock Change of Normal Butylene (Thousand Barrels) | ||||||||
| Year | Jan | Feb | Mar | Apr | May | Jun | Jul | Aug | Sep | Oct | Nov | Dec |
|---|---|---|---|---|---|---|---|---|---|---|---|---|
| 2010 | 92 | 217 | 386 | -583 | -24 | 2 | -22 | 31 | 404 | -168 | 50 | -376 |
| 2011 | 273 | -43 | 209 | 417 | -221 | 27 | 73 | 26 | -134 | -76 | 34 | 25 |
| 2012 | -236 | -54 | -11 | 106 | -152 | 256 | 117 | 6 | 137 | -163 | -161 | 61 |
| 2013 | 44 | -134 | 483 | -551 | -117 | 744 | -614 | 1,275 | 1,348 | -1,748 | 504 | -819 |
| 2014 | 152 | -286 | 189 | -174 | 137 | 787 | -534 | 875 | 71 | 235 | -2,044 | -67 |
| 2015 | 661 | 147 | -30 | -69 | -204 | 754 | -5 | -529 | 1,852 | -1,435 | -1,054 | -5 |
| 2016 | 424 | -180 | -412 | 1,194 | -957 | 549 | 346 | -450 | 790 | 337 | 125 | -168 |
| 2017 | 63 | -296 | -314 | -830 | 839 | -100 | 211 | -1,135 | 83 | -276 | 180 | 337 |
| 2018 | -425 | 288 | 687 | -222 | -207 | 541 | -209 | 900 | -278 | -134 | -199 | -772 |
| 2019 | 287 | 88 | 15 | -640 | 177 | -192 | 1,009 | -242 | -557 | 1,468 | -1,756 | 478 |
| 2020 | -803 | 744 | 797 | -158 | 486 | -527 | 1,126 | 574 | -1,736 | 784 | -1,869 | -85 |
| 2021 | -15 | 63 | -10 | -3 | -83 | 92 | -99 | 266 | -160 | 118 | -13 | -176 |
| 2022 | -83 | 49 | -68 | 82 | -53 | -45 | 222 | -75 | 288 | 182 | -239 | -166 |
| 2023 | 186 | 87 | -274 | -229 | 156 | 18 | -90 | -37 | -74 | 402 | -237 | -40 |
| 2024 | -103 | 47 | -60 | -19 | ||||||||
| - = No Data Reported; -- = Not Applicable; NA = Not Available; W = Withheld to avoid disclosure of individual company data. |
| Release Date: 6/28/2024 |
| Next Release Date: 7/31/2024 |