|
Download Data (XLS File) |
|
||||||||
|
||||||||
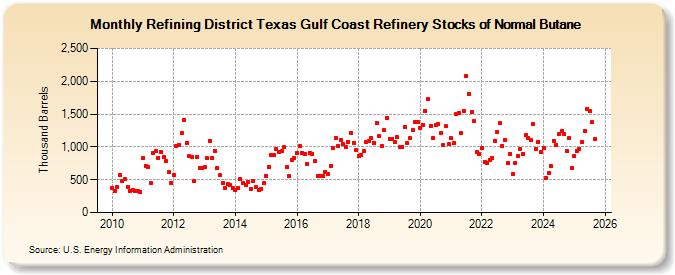
| Refining District Texas Gulf Coast Refinery Stocks of Normal Butane (Thousand Barrels) | ||||||||
| Year | Jan | Feb | Mar | Apr | May | Jun | Jul | Aug | Sep | Oct | Nov | Dec |
|---|---|---|---|---|---|---|---|---|---|---|---|---|
| 2010 | 376 | 322 | 392 | 574 | 478 | 504 | 392 | 328 | 342 | 333 | 331 | 317 |
| 2011 | 827 | 714 | 688 | 446 | 914 | 930 | 838 | 926 | 853 | 783 | 617 | 453 |
| 2012 | 572 | 1,011 | 1,031 | 1,207 | 1,416 | 1,056 | 855 | 847 | 476 | 848 | 679 | 679 |
| 2013 | 696 | 824 | 1,092 | 838 | 939 | 673 | 566 | 445 | 375 | 435 | 418 | 372 |
| 2014 | 339 | 376 | 517 | 443 | 421 | 460 | 359 | 484 | 396 | 340 | 364 | 444 |
| 2015 | 564 | 693 | 872 | 883 | 966 | 923 | 932 | 994 | 697 | 554 | 806 | 828 |
| 2016 | 910 | 1,006 | 914 | 899 | 743 | 907 | 890 | 785 | 559 | 550 | 550 | 623 |
| 2017 | 588 | 706 | 986 | 1,142 | 1,021 | 1,108 | 1,038 | 995 | 1,076 | 1,214 | 1,064 | 954 |
| 2018 | 854 | 880 | 931 | 1,077 | 1,094 | 1,132 | 1,065 | 1,368 | 1,164 | 1,020 | 1,252 | 1,438 |
| 2019 | 1,120 | 1,122 | 1,079 | 1,145 | 996 | 1,002 | 1,300 | 1,061 | 1,129 | 1,250 | 1,383 | 1,377 |
| 2020 | 1,295 | 1,340 | 1,554 | 1,729 | 1,319 | 1,133 | 1,326 | 1,348 | 1,210 | 1,034 | 1,311 | 1,044 |
| 2021 | 1,129 | 1,058 | 1,500 | 1,523 | 1,211 | 1,547 | 2,076 | 1,805 | 1,533 | 1,388 | 925 | 891 |
| 2022 | 982 | 771 | 762 | 802 | 829 | 1,094 | 1,228 | 1,359 | 1,014 | 1,106 | 757 | 897 |
| 2023 | 581 | 755 | 862 | 968 | 893 | 1,178 | 1,137 | 1,106 | 1,345 | 974 | 1,079 | 929 |
| 2024 | 987 | |||||||||||
| - = No Data Reported; -- = Not Applicable; NA = Not Available; W = Withheld to avoid disclosure of individual company data. |
| Release Date: 3/29/2024 |
| Next Release Date: 4/30/2024 |
Referring Pages: