|
Download Data (XLS File) |
|
||||||||
|
||||||||
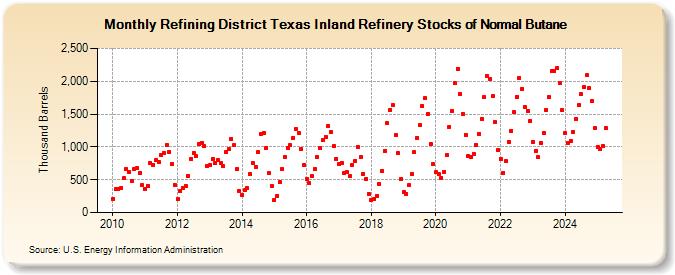
| Refining District Texas Inland Refinery Stocks of Normal Butane (Thousand Barrels) | ||||||||
| Year | Jan | Feb | Mar | Apr | May | Jun | Jul | Aug | Sep | Oct | Nov | Dec |
|---|---|---|---|---|---|---|---|---|---|---|---|---|
| 2010 | 209 | 352 | 360 | 379 | 519 | 666 | 622 | 478 | 657 | 678 | 604 | 418 |
| 2011 | 364 | 409 | 757 | 731 | 800 | 764 | 869 | 914 | 1,032 | 922 | 740 | 424 |
| 2012 | 206 | 333 | 381 | 412 | 561 | 811 | 914 | 857 | 1,043 | 1,061 | 1,011 | 716 |
| 2013 | 720 | 813 | 758 | 797 | 750 | 707 | 916 | 963 | 1,122 | 1,023 | 661 | 331 |
| 2014 | 272 | 339 | 369 | 582 | 755 | 699 | 919 | 1,199 | 1,213 | 985 | 596 | 411 |
| 2015 | 197 | 257 | 458 | 663 | 847 | 987 | 1,025 | 1,143 | 1,280 | 1,210 | 962 | 728 |
| 2016 | 517 | 448 | 555 | 664 | 848 | 983 | 1,106 | 1,158 | 1,320 | 1,224 | 1,013 | 819 |
| 2017 | 733 | 762 | 603 | 613 | 554 | 725 | 791 | 999 | 845 | 591 | 513 | 285 |
| 2018 | 184 | 200 | 253 | 434 | 640 | 945 | 1,361 | 1,569 | 1,634 | 1,177 | 900 | 510 |
| 2019 | 313 | 289 | 418 | 588 | 921 | 1,142 | 1,327 | 1,625 | 1,738 | 1,505 | 1,047 | 733 |
| 2020 | 617 | 592 | 530 | 622 | 873 | 1,308 | 1,548 | 1,968 | 2,193 | 1,802 | 1,506 | 1,187 |
| 2021 | 860 | 839 | 897 | 1,035 | 1,201 | 1,431 | 1,757 | 2,085 | 2,038 | 1,769 | 1,379 | 948 |
| 2022 | 821 | 605 | 781 | 1,081 | 1,247 | 1,528 | 1,764 | 2,054 | 1,888 | 1,603 | 1,553 | 1,397 |
| 2023 | 1,071 | 940 | 840 | 1,061 | 1,219 | 1,565 | 1,753 | 2,151 | 2,157 | 2,208 | 1,968 | 1,561 |
| 2024 | 1,205 | 1,052 | 1,094 | 1,232 | ||||||||
| - = No Data Reported; -- = Not Applicable; NA = Not Available; W = Withheld to avoid disclosure of individual company data. |
| Release Date: 6/28/2024 |
| Next Release Date: 7/31/2024 |
Referring Pages: