|
Download Data (XLS File) |
|
||||||||
|
||||||||
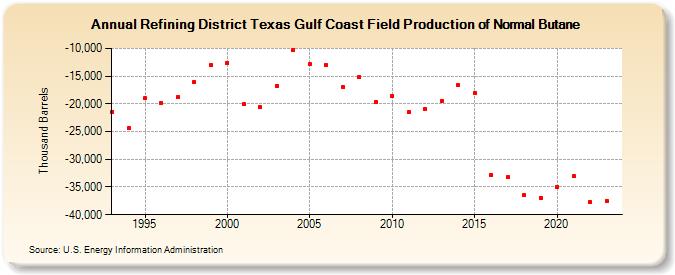
| Refining District Texas Gulf Coast Field Production of Normal Butane (Thousand Barrels) | ||||||||
| Decade | Year-0 | Year-1 | Year-2 | Year-3 | Year-4 | Year-5 | Year-6 | Year-7 | Year-8 | Year-9 |
|---|---|---|---|---|---|---|---|---|---|---|
| 1990's | -21,399 | -24,432 | -19,037 | -19,846 | -18,738 | -16,080 | -13,023 | |||
| 2000's | -12,626 | -20,114 | -20,600 | -16,769 | -10,244 | -12,879 | -12,988 | -16,976 | -15,129 | -19,706 |
| 2010's | -18,567 | -21,488 | -20,961 | -19,447 | -16,658 | -18,083 | -32,849 | -33,217 | -36,482 | -36,936 |
| 2020's | -34,970 | -33,093 | -37,740 | -37,512 |
| - = No Data Reported; -- = Not Applicable; NA = Not Available; W = Withheld to avoid disclosure of individual company data. |
| Release Date: 3/29/2024 |
| Next Release Date: 8/30/2024 |